How much, where?
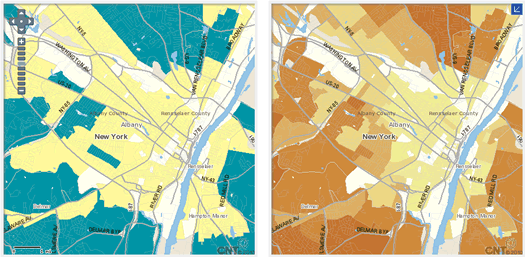
One the left, home prices as a percentage of median income. On the right, household median income.
Here's something that might help you kill time until you can leave work get a better picture of the Capital Region.
The Housing + Transportation Affordability Index is an online mapping tool that lets you apply all sorts of filters to local maps -- housing affordability, median household incomes, autos per household, transportation costs and so on. The maps are based on census data.
The index is a project of the Center for Neighborhood Technology, which promotes "more livable and sustainable urban communities." That viewpoint shows up in some of the explanations on the site.
[via Jen]
screengrab: CNT
... said KGB about Drawing: What's something that brought you joy this year?