A bunch of numbers about a bunch of different topics
A chart about violent crime from the report.
How many people are here? What's the range of incomes? How are people getting around? What direction are crime rates headed?
Numbers related to those questions -- and many other topics -- are stuffed into the aptly-titled "Capital Region Statistical Report," which was released today by the Capital District Regional Planning Commission.
And it is exactly what it sounds like: a bunch of numbers about a bunch of topics in the Capital Region from a bunch of different sources, all aggregated in one report.
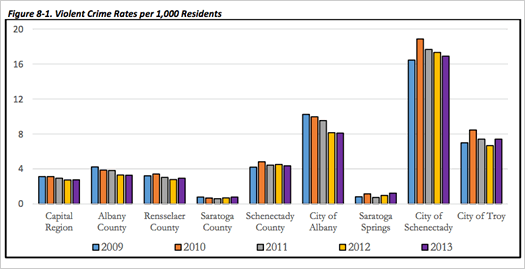
One example is above -- it's a chart from the report about annual violent crimes per 1,000 people in areas of the Capital Region. And it includes this short discussion of the chart:
Data Highlights:
+ Between 2009 and 2013, the Capital Region saw a decrease in violent crime of 11.7%.
+ During the same period, the city of Albany saw a 20.9% decrease in violent crime. Albany County as a whole experienced a 22.3% decrease.
+ The City of Schenectady's violent crime rate is noticeably higher than that of the other three cities. In 2013 Schenectady recorded twice as many violent crimes as the City of Albany after adjusting for population size.
There are many other similar charts/tables and short discussions in the report. And, of course, like any data of this sort, the numbers often should be the starting point for a closer look or conversation than an endpoint. But it's helpful to have an easy place to look.
Farther down the rabbit hole: If you're interested in this sort of data -- whether for your job or school or just out of curiosity -- we highly recommend taking a little bit of time to learn how to use the Census Bureau's American Fact Finder tool (especially the advanced search function). There's a little bit of a learning curve, but once you get the hang of it, it makes pulling this sort of data from the Census Bureau a lot easier. We use it multiple times each month for AOA.
chart: Capital District Regional Planning Commission
... said KGB about Drawing: What's something that brought you joy this year?