Another year of record-high CDTA bus ridership
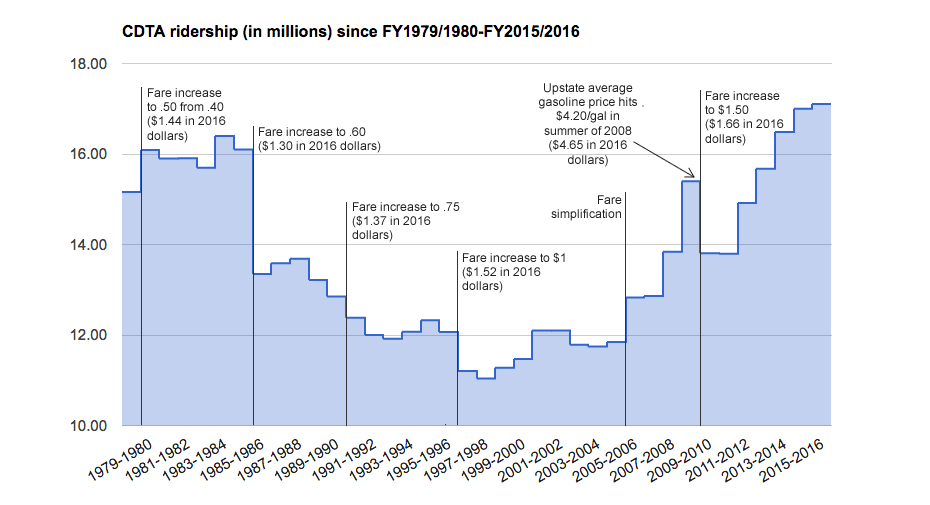
CDTA announced this week that it had more than 17.1 million passenger boardings during the fiscal year that ended in March -- a record high for the transit org. It's the third straight year CDTA has set a new annual ridership record.
Boardings were up 1 percent compared the previous fiscal year. And CDTA says they're up 25 percent compared to five years ago.
What's driving the increase? One big factor appears to be the increasing number of "universal access" agreements CDTA has formed with multiple organizations (such as local colleges) in recent years, under which people connected with the orgs are provided unlimited free rides. CDTA says boardings that are part of this program now make up 25 percent of all the systems rides.
CDTA ridership hit low point during the late 1990s and has been trending upward overall since then. After the jump there's a graph of the numbers from 1980 to now.
Look up
The graph is above in large format -- click or scroll all the way up.
Say Something!
We'd really like you to take part in the conversation here at All Over Albany. But we do have a few rules here. Don't worry, they're easy. The first: be kind. The second: treat everyone else with the same respect you'd like to see in return. Cool? Great, post away. Comments are moderated so it might take a little while for your comment to show up. Thanks for being patient.
Comments
It's good news that ridership has been going up. But I don't have a good sense of the baseline. Is 17 million rides/year good for city of Albany's size? How do we compare to other similar cities? If anyone knows where to find the data, I'd love to hear about it.
... said Jason on Apr 28, 2016 at 4:16 PM | link
@Jason: That's a good question. I'll do some digging.
... said Greg on Apr 28, 2016 at 5:14 PM | link
17 million riders, assuming 250 days x 2 tripsper day, means 34 thousand daily riders within about 1 million area, 3.4%
Include connecting traffic, weekend trips - i would guesstimate 2-2.5% bus commuters
Use https://upload.wikimedia.org/wikipedia/commons/8/8e/USCommutePatterns2006.png to compare with other US cities
... said Mike on Apr 28, 2016 at 6:23 PM | link
To add to what Jason said it'd be interesting also to find out:
- ridership by route at least in a broad sense
- ridership per distance travelled by the buses.
- ridership growth with growth of population.
... said S on Apr 28, 2016 at 6:30 PM | link
S. - some route performance numbers are available from CDTA:
http://www.cdta.org/sites/default/files/pdfs/2015_route_performance_report_-_final.pdf
... said Mike on Apr 29, 2016 at 8:38 AM | link
I know why I take the bus more - because it's easier to take now!
Busplus from Schenec to Albany gives me a nice relaxing ride and I can do work or read my book, I basically gain an extra hour of my life.
Can't wait for the navigator cards to ramp up. Much better than those ten trips.
... said Justin on Apr 29, 2016 at 9:36 AM | link
S, you can see individual route stats in the annual performance reports. For growth compared to population growth, AOA dissected the 2010 Census data a bit... it's a tough comparison because of the simultaneously wide and narrow area CDTA serves.
As for ridership per distance, I'd be wary of that stat. I guess you're asking for riders divided by end-to-end distance of a route. I think it would be easy to suggest that a far-flung route serving suburbs/outskirts is "less productive" than a denser trunk or urban loop; i.e. routes that people ride for shorter distances will see higher riders-per-mile. It would be an interesting stat but I'd hate to see it as justification to eliminate some true commuter routes.
... said -B on Apr 29, 2016 at 9:38 AM | link
I wonder what the breakdown is by height and weight riders as compared to other American cities whose name begins with the letter "A"?
... said Jackers on Apr 29, 2016 at 9:42 AM | link
@Jason/Greg
Judging transit systems can be difficult, for there are several metrics one can look at, and it can be hard to rank systems, for it all depends on how you want to weight each measure. There is the popular breakout (looking at you U.S. Census) of percent of population riding, which gives us a good 10,000 foot view of who is using the system, but doesn’t really offer much beyond that. There is the measure of ridership per capita, which gives you a good sense of how often a system is being utilized by those who do use it, and in my mind offers us a good idea of how many cars are kept off the road (which is an important data point to remind those who don’t see the value in public transit about how it helps free up the road for them to drive). There is frequency and access measures, which are good indicators about the efficiency and reliability of a system, and do go hand in hand with ridership (e.g. more access, more route trips per hour typically lead to more use). And recently, connectivity to job centers and multi-modal options (e.g. bus to airport, bus to train, bus to car-share) has been an increasingly researched topic.
Doing some back of the napkin math, the per capita ridership for CDTA is 21.3 trips per resident. My math is strictly off of the four county footprint of CDTA: Albany, Schenectady, Rensselaer and Troy (17.1 million rides divided by 804,000 residents). Given that Saratoga only accounts for 4% of CDTA ridership, if you eliminate Saratoga residents and ridership from the numbers, you get a per capital ridership of 27.3 trips per resident (17.1 million total rides minus 624k rides within Saratoga; 16.476 million rides divided by 603,300 residents). I tried to dig up per capita ridership rankings across the country, but couldn’t find anything meaningful. Nate Silver at FiveThirtyEight (http://fivethirtyeight.com/datalab/how-your-citys-public-transit-stacks-up/) came the closest, with CDTA ranked at a respectful 48th in the nation. However, looking at their math, it seems they dropped off Saratoga in their measure, so you have to go into this ranking understanding that it only measures the core cities (and their respective counties). For our region specifically, this measure can be used in a few ways, but for me, it demonstrates that CDTA for 21.3 days of the year, keeps our streets car free. In fact, this number is probably double that (say 42 days of the year, or 11% of the year), if you strip from the math those residents who don’t drive (kids, elderly, etc.). Additionally, given Saratoga’s low ridership numbers, if you just look at the Albany-Schenectady-Troy area, you get closer to 27 car free days per year. Temporally analysis shows that if you go back five years, where ridership was at 13.8 million and the four county population was about 1.2% lower, per capita ridership was about 17.4. So over five years, CDTA has helped to add 4 more car-free days in the region.
Recently, many have started to scrutinize transit systems not just in percentage of ridership against other modes of travel (aka private vehicles), but in how well they function in bringing people to jobs or plugging them into life’s required chores (e.g. grocery shopping, doctors visit, daycare, etc.). CDTA, as many transit systems, are doing what they can to not only enhance frequency (very important for encouraging ridership, when they are assured they can readily get on and off routes to quickly perform a chore), but connect their systems to job centers. This is harder, because while many will fault a transit system for not properly connecting to the jobs, they are far more charitable to communities and businesses who are lax or outright refuse to encourage job growth along transit corridors. To pardon the pun, it’s a two way street. AOA did recently feature a new transit data repository, AllTransit, that has a deep mix of data to judge transit systems more holistically along these lines. For instance, the city of Albany ranked fairly well with a score of 7.8 (or 182 of all transit systems), if you are concerned with frequency, access to jobs, and connectivity (here’s Albany’s metrics: http://alltransit.cnt.org/metrics/?addr=Albany,%20NY,%20USA).
@S, you can find annual route performance information on CDTA’s website (http://www.cdta.org/annual-route-performance-report/18) which is useful in seeing how routes are doing the prior fiscal year, to include broader analysis of temporal ridership gains by route (to include a break down by rides per hour to access route performance). Like with any system, as you can see from the data, denser routes (within the core cities) subsidize the longer, typically more suburban routes (see above back of the napkin math about how Saratoga County, which accounts for 4% of CDTA ridership, but represents a 22% drag on per capita ridership in the region). This is a tradeoff that will have to be made in the foreseeable future in order to build out and foster ridership in areas of the region that historically haven’t been transit rich in ridership.
... said Rich on Apr 29, 2016 at 10:00 AM | link
Rich - I hate to rain on your parade, but you have to divide your car-free days by 2, if not by 4, to account for the fact that very few people work 24 hour shifts and at least 2 trips a day for a daily round-trip is a more reasonable pattern. Then, with elimination of transfers, CDTA counts only boardings, not door to door trips in their statistics.. How many riders are connecting?
... said Mike on Apr 29, 2016 at 10:35 AM | link
@Mike (with egg on face) In the infinite words of Mark Twain: "“It ain't what you don't know that gets you into trouble. It's what you know for sure that just ain't so.†I could blame my poor statistical analysis on limited sleep and too little coffee, end of day though, it was poorly planned and rushed. Thanks for the spotting!
... said Rich on Apr 29, 2016 at 1:17 PM | link