A little dry

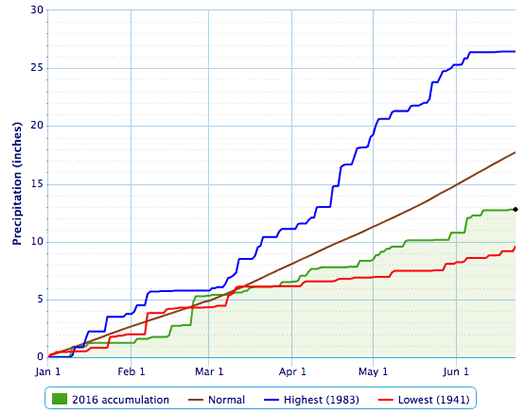
Accumulated precipitation for the Albany area for 2016 so far.
We noticed a few people watering lawns recently, and that got us curious about how this area's doing in terms of rainfall lately. So we looked up the numbers via the NWS Albany website, which very helpfully generated the graph above.
That precipitation accumulation since the start of 2016. The green line is this year's accumulated total, the brown line is the 30-year normal, and the red and blue lines are the record lows and highs.
As you can see, we're a bit behind the normal for the year. And for the month of June so far, the Albany area's at a little more than 2 inches -- about .8 inches off the normal. But over the past month parts of the state have been relatively dry -- see this map from the NWS Binghamton office.
graph: NWS Albany
Say Something!
We'd really like you to take part in the conversation here at All Over Albany. But we do have a few rules here. Don't worry, they're easy. The first: be kind. The second: treat everyone else with the same respect you'd like to see in return. Cool? Great, post away. Comments are moderated so it might take a little while for your comment to show up. Thanks for being patient.
... said KGB about Drawing: What's something that brought you joy this year?