Jump to the intro.
Gubernatorial election map
Here's a clickable county map of results from the gubernatorial election. The shading represents the Andrew Cuomo / Marc Molinaro matchup. The deeper the color blue (Cuomo) or red (Molinaro), the bigger the win in that county. If you click the county there's an info window with numbers for all the candidates.
If anything, this map points to an ongoing urban/rural split in the state, a pattern that shows up around the country.
One interesting local third-party bit: Albany County had the second highest votes percentage for Howie Hawkins of the Green Party, behind only Tompkins County (Ithaca). (Though the Green Party still rolled up many more votes in the NYC counties just because of the much larger overall number of voters.)
Gubernatorial election treemap
Any representation of data is flawed in some way (or many ways). One of the ways that maps skew the representation of voting data is that they depict areas rather than actual voters.
So this is a "treemap" of the voting in the gubernatorial election -- it's kind of like a square pie chart. It depicts each county's vote total as a portion of the overall state total. (The shading again indicates which candidate won the county and to what degree.)
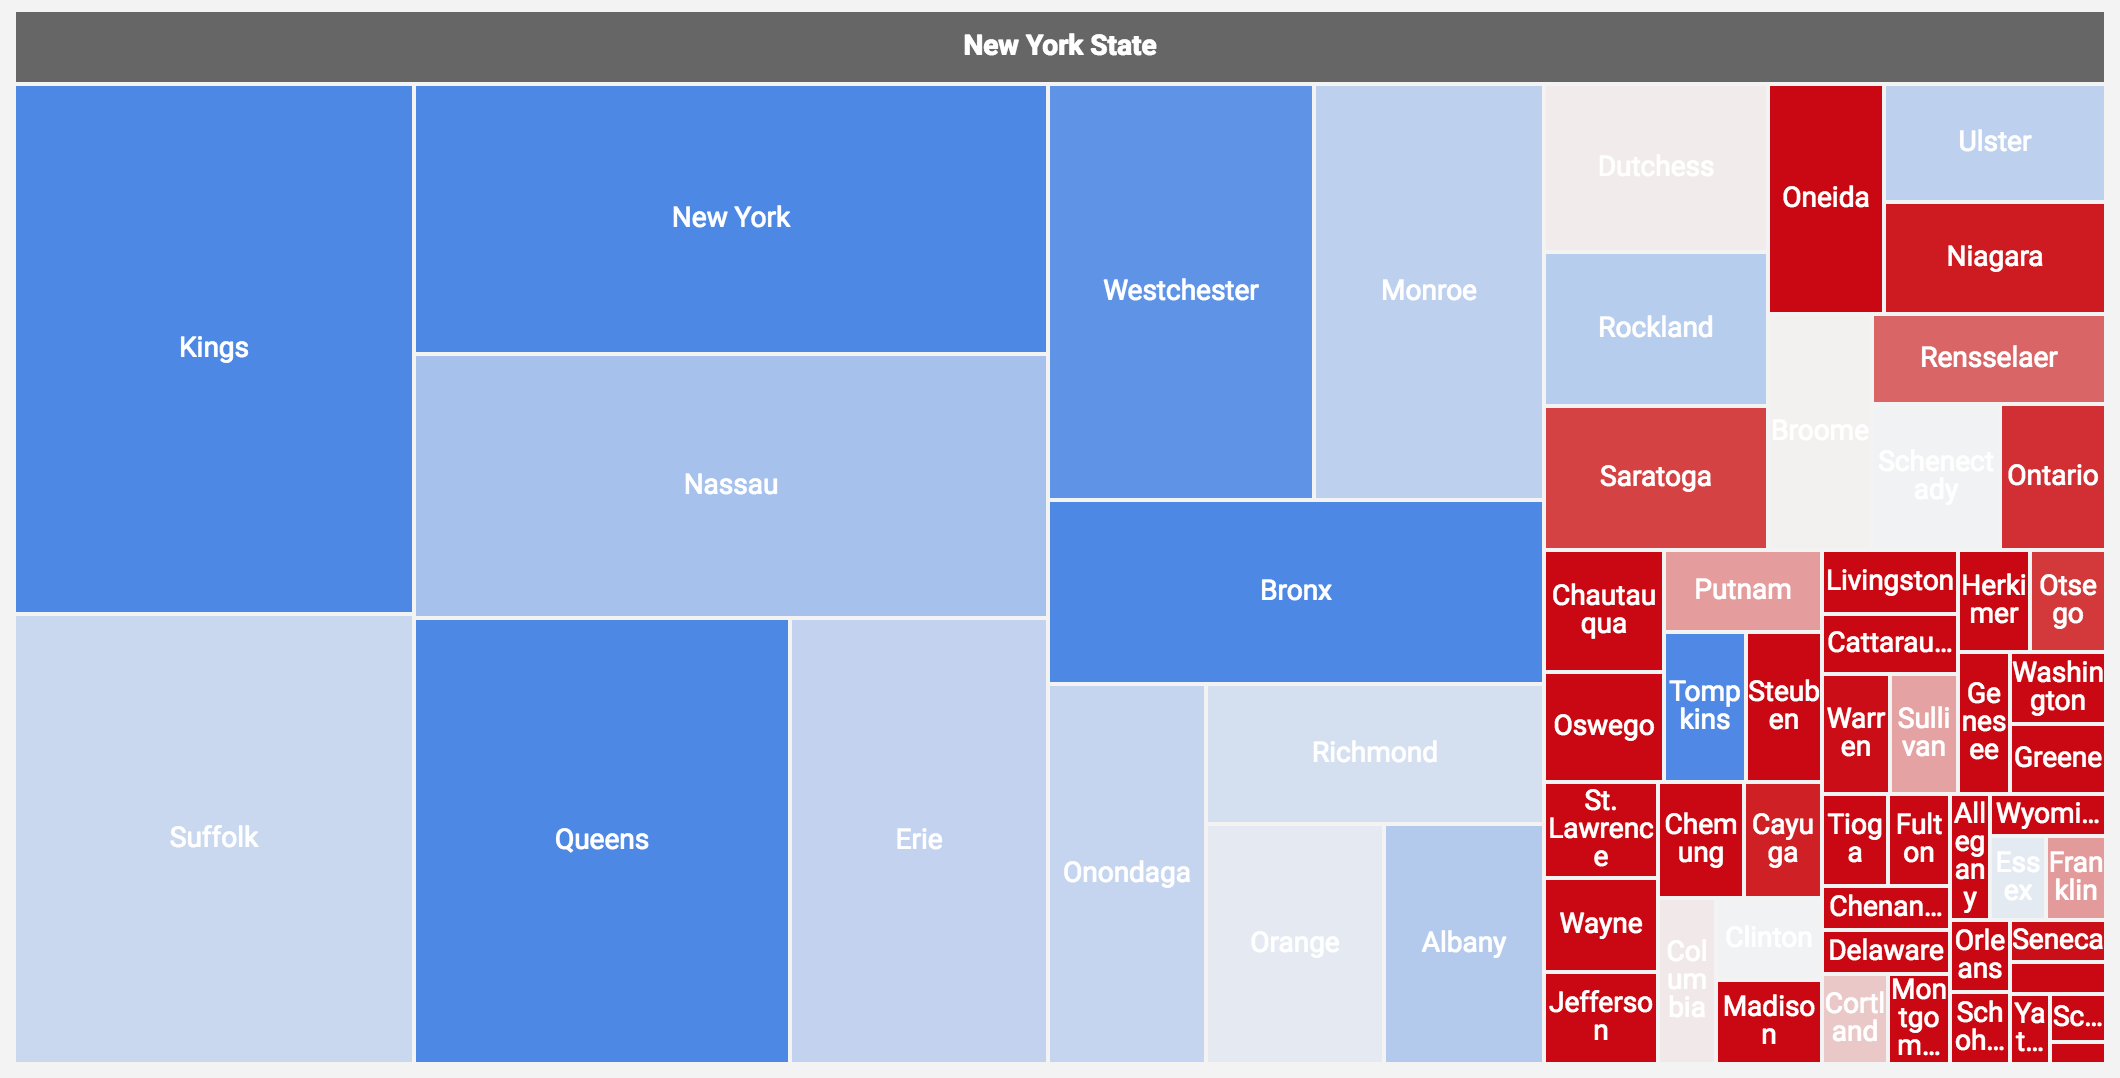
Having the election results displayed this way illustrates the influence of the New York City area and its huge vote totals compared to the rest of the state.
Voter turnout
There were a lot of anecdotes floating around Tuesday about big voter turnout, as Democrats were energized to oppose Donald Trump and Republicans were trying to counter.
So here's a graph looking at voter turnout statewide for the past five Congressional/New York State elections.
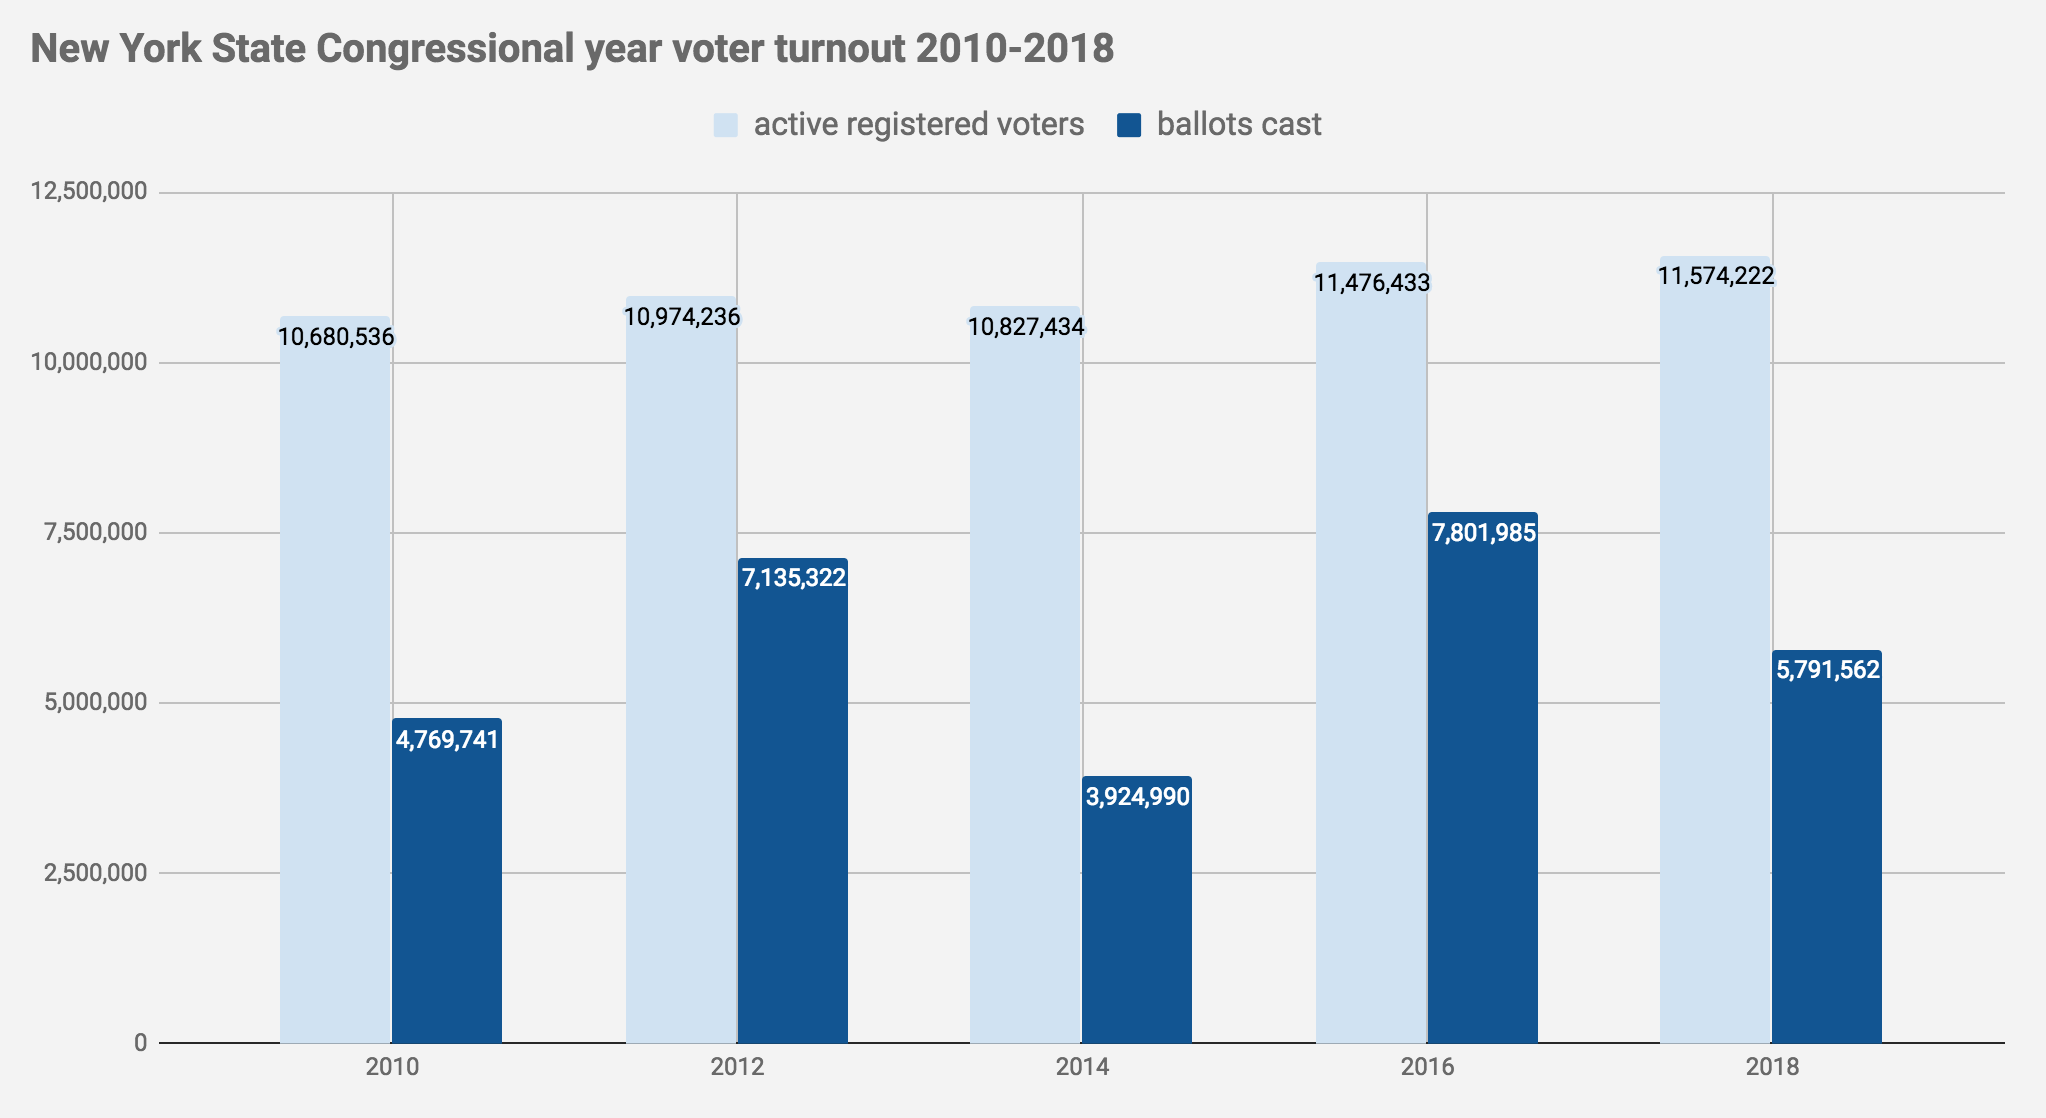
The best comparisons for 2018 are probably 2014 and 2010 because, like this year, those weren't presidential election years (which tend to have the highest turnouts). And from that perspective, yeah, the turnout this time around was relatively high, especially compared to 2014. (Note also that 2018 had the highest number of active registered voters during this time span.)
That said, New York State still only had 50 percent of the number of active registered voters end up casting ballots.
Local Congressional election turnout
The big story nationally in this election was which party would end up with control of the House of Representatives. And the NY-19 Congressional District -- a matchup between incumbent Republican John Faso and Democratic challenger Antonio Delgado -- was one of the possibly key elections for that overall story.
Also: Democrats -- and probably a lot of others -- are trying to find any sort of pushback against the Trump administration. And voting for Congress is one way to do that.
So, we were curious about turnout for the three local Congressional matchups. And we also added in the NY-22, which isn't really part of the Capital Region, but it's next door and Democratic challenger Anthony Brindisi is currently leading incumbent Republican Claudia Tenney (who's been a vocal Trump supporter).
Please note that the y-axis does not start at 0.
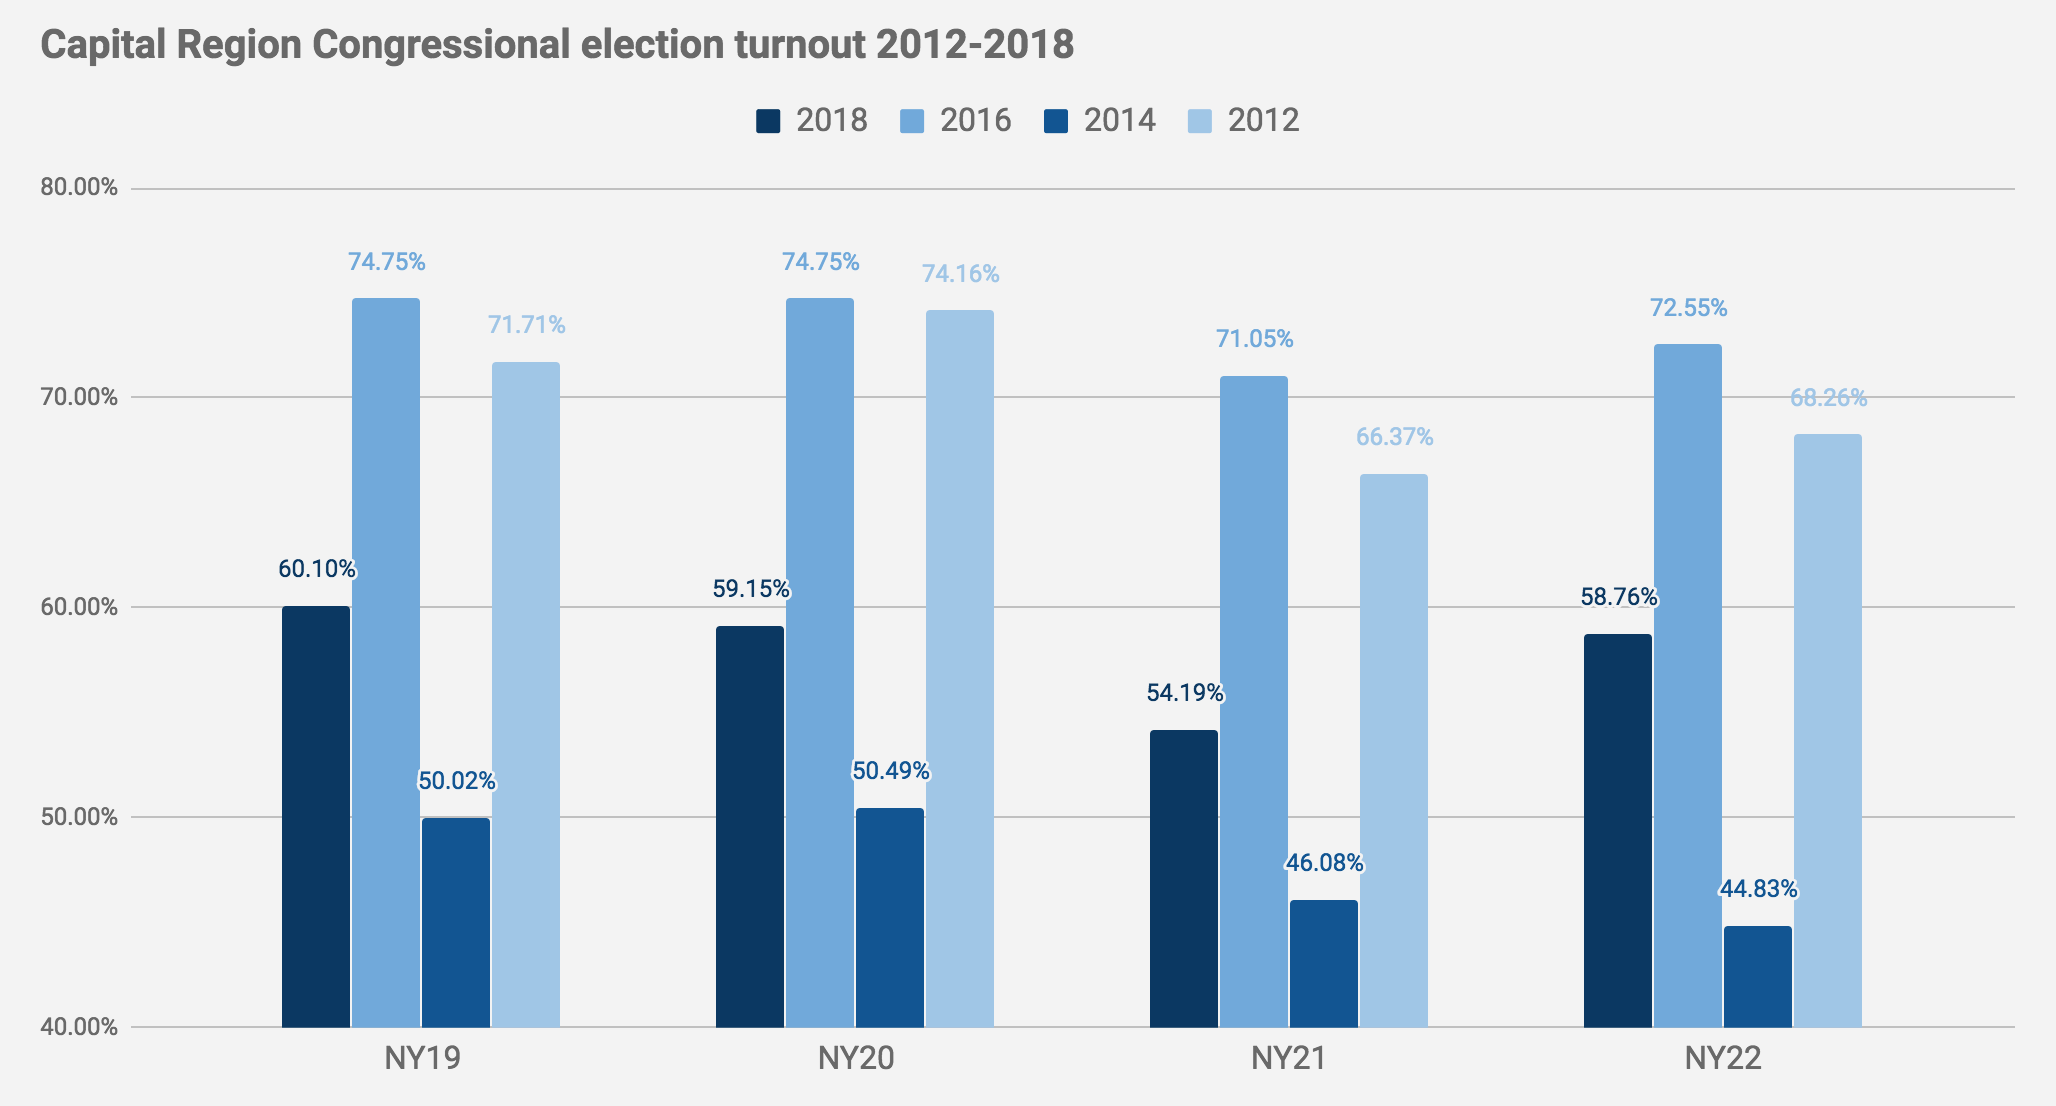
Again, the best comparison is probably not two years ago, but four years ago because that also wasn't a presidential election year. And, yeah, it looks like there was a large increase in voter turnout out in these elections -- especially next door in the NY-22.
(It'd be interesting to see what turnout was like in the New York State Senate districts that flipped, which was the big New York State story of this election.)
Who's most popular?
This probably doesn't mean much, but we thought it'd be mildly interesting to see which of the winning statewide candidates this time around got the most number of votes.
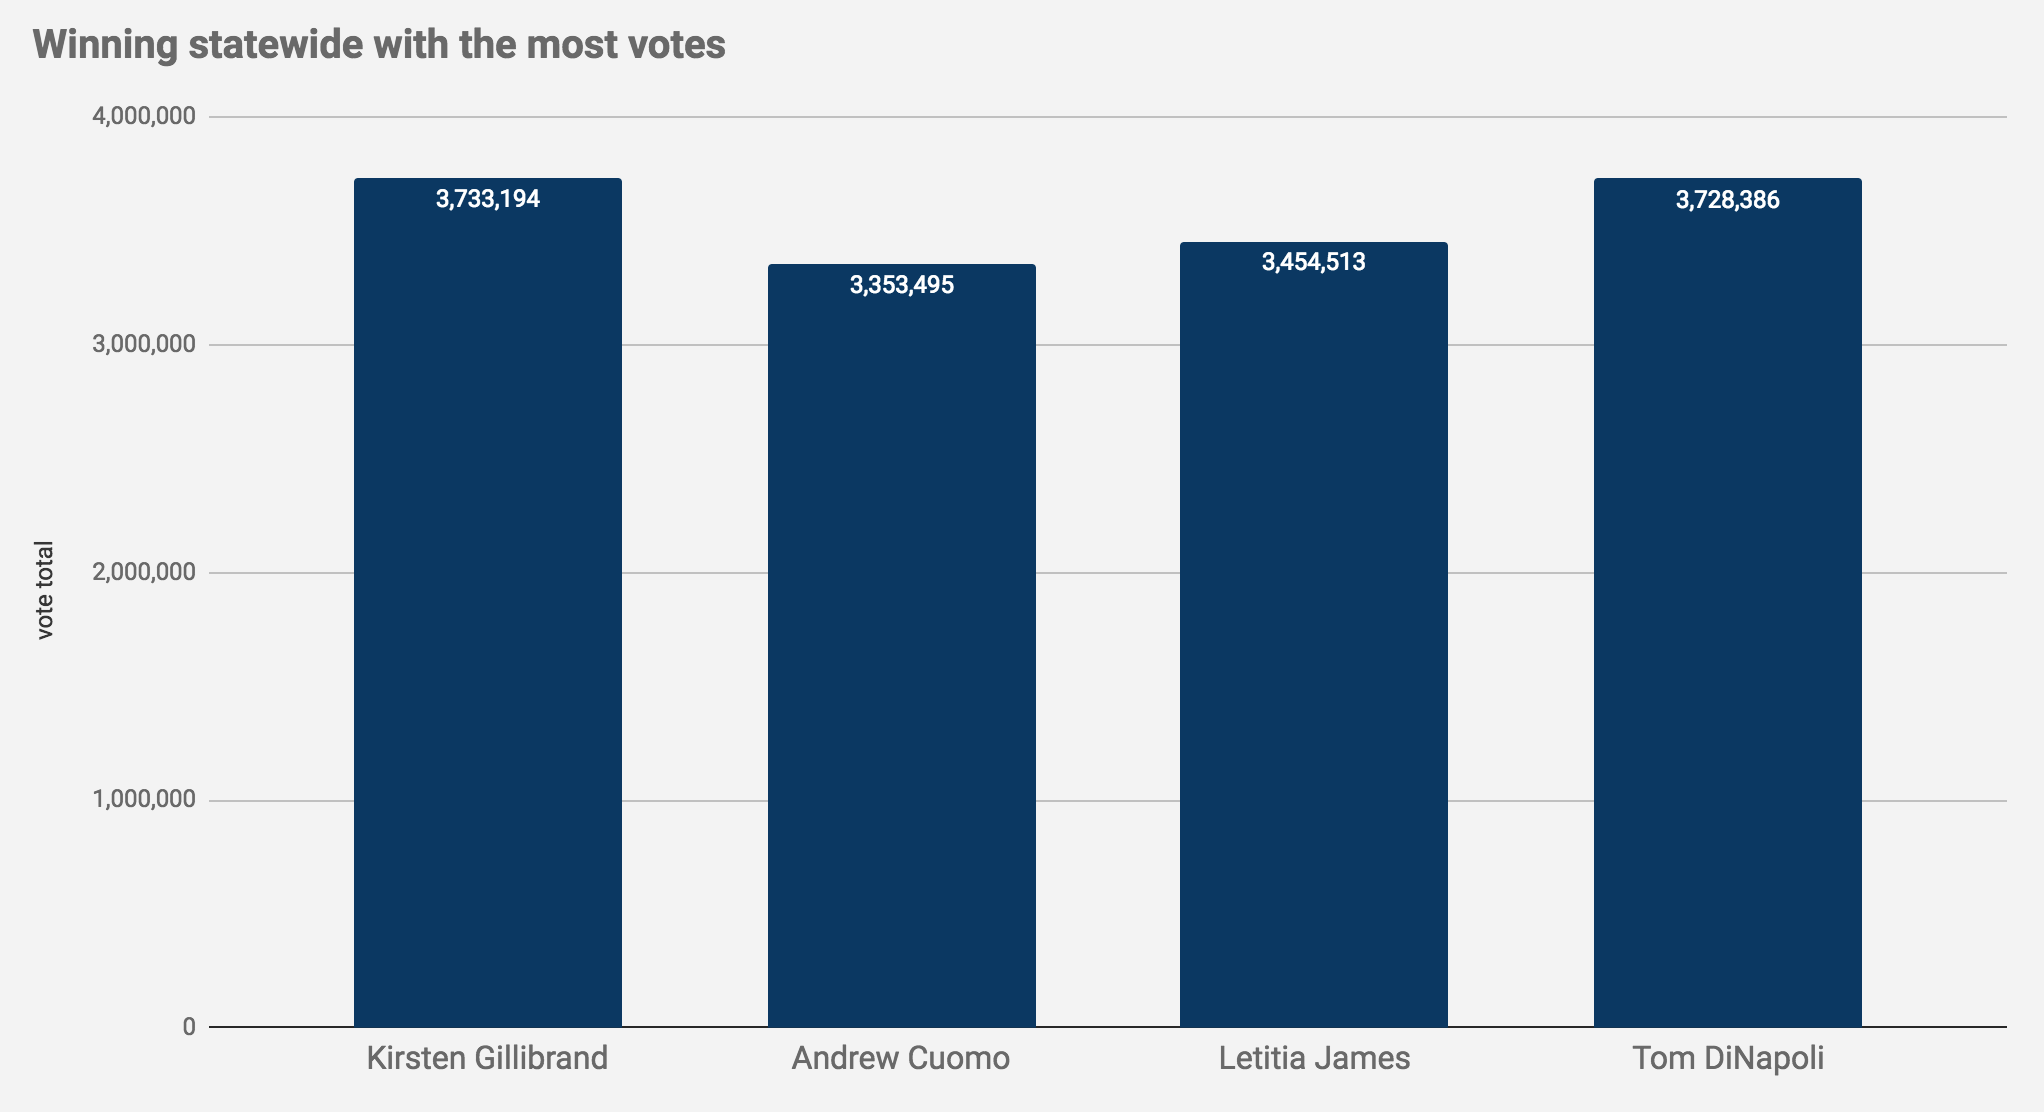
Kirsten Gillibrand takes the title by just a few thousand votes over Tom DiNapoli.
You might have heard that there are a lot of votes around New York City.
A few more bits from Election Day 2018 -- about the geographical split in the gubernatorial election, voter turnout, and the unofficial popularity contest.
In (clickable) map and chart form, of course.
Maps and charts
They're at the top in large format -- click or scroll all the way up.
About the numbers
All numbers are via the NYS Board of Election website: voter enrollment | election results.
The 2018 election results are unofficial and almost certainly will change a little bit by the time they're official and final.
When referring to voter turnout, we're defining that as the number of ballots cast in the November election divided the number of reported active enrolled voters as of November 1 of that year.
Comments
Great analysis of the vote. There is another side that has not yet been mentioned though. Take a look at the vote for Governor by party. The Women’s Equality Party (WEP) and the Reform Party (REF) apparently did not meet the 50K vote threshold to remain on the ballot. Have they gone the way of the old Liberal Party in NY? On the other hand, Stephanie Miner’s Serve America Movement (SAM) has qualified to be on the state ballot for the next four years. Will this now become a sought after additional line for candidates?
... said David Galletly on Nov 8, 2018 at 7:21 AM | link