Charting the Capital Region's workday population tide

That is a lot of office space...
Most of the time when we talk about "population" it's in reference to how many people live in a place. But that doesn't necessarily give the best sense of how many people frequent that city/town/village.
For example: the city of Albany's population on weekdays increases almost 67 percent during weekdays, according to Census Bureau estimates.
So, to get a better sense of how the population "tide" drifts around the Capital Region on a weekday, we thought it'd be interesting to pull daytime population numbers for cities, towns, and villages around the Capital Region -- and then rank and map them.
Look up
Both a map and table are in large-format above -- scroll all the way up.
A few things
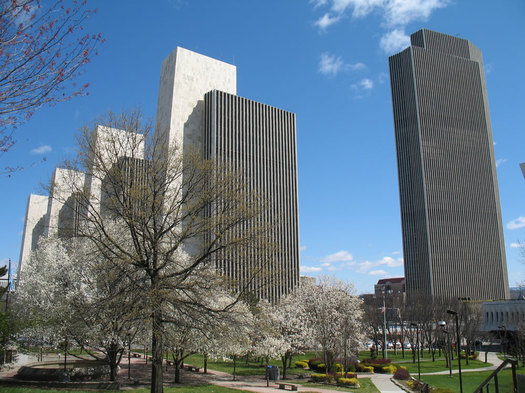
+ It's not surprising that the city of Albany tops the list for biggest daytime population swing -- its downtown is full of offices, including the ESP. And it also has the Harriman office campus uptown. But we were a little taken aback by the how large the difference is -- an increase of 2/3!
The large swing is a boon for a city. But it also points to some of the challenges -- like parking and maintaining infrastructure for all those additional daytime workers.
+ Again, Colonie and Saratoga Springs' spots near the top aren't much of a surprise. But check out tiny Ballston Spa representing with a 21 percent increase.
+ Conversely, we expected Troy and Schenectady to both have bigger daytime increases. Especially Troy -- its downtown always seems packed during the daytime.
+ The fact that suburban places like New Scotland lose a lot of their population during the day isn't unexpected. But Cohoes and Watervliet -- more urban places in the Capital Region core -- also see large daytime decreases.
+ These numbers are based on 5-year estimates from 2006-2010 (explained below). We have feeling the next set of estimates will show Malta -- with the GloFo fab -- swinging closer to the break-even mark, if not into the positive.
Data and acknowledgements
+ All population and commuter data are from the US Census Bureau. The numbers are from the 5-year estimates for the American Community Survey 2006-2010. These are estimates, and for some of the smaller population places, the margins of error do start to grow, so a grain or two of salt to keep in mind.
+ We had this idea to build the map after reading Kenneth C. Crowe II's recent story in the Times Union. So, a tip of the hat to him.
+ And thanks to Inquiron for the super-easy-to-use shapefile to KML converter.
Hi there. Comments have been closed for this item. Still have something to say? Contact us.
Comments
"The large swing is a boon for a city. But it also points to some of the challenges -- like parking and maintaining infrastructure for all those additional daytime workers."
The challenges that Albany faces with its large swing in daytime population might also support moving more state agencies to locations outside the city and county. One can argue that in today's digital world there's less need for many state agencies to be co-located.
... said Bob on Jun 26, 2013 at 5:21 PM | link
@Bob -- Not only do agencies not need to be in the same location, many employees should be able to telecommute at least part of the week. But the State of New York is notoriously behind the times on adopting telecommuting. My former agency (State Ed.) refuses to even discuss a pilot project with the unions. Most of the agencies do not allow telecommuting, then OGS whines about the parking problem.
... said chrisck on Jun 26, 2013 at 6:05 PM | link
I was let down by the TU article. I figured that you'd do a better article and I was right.
I use Quantum GIS for my causal mapping & projection needs.
... said Tim on Jun 27, 2013 at 10:00 AM | link
Maybe a commuter tax is in order?!
... said Elisabeth on Jun 27, 2013 at 11:10 AM | link
Bahh! City tax for state workers!
... said Lucy on Jun 27, 2013 at 12:29 PM | link
I agree with Elisabeth but I can already hear the complaints about it pouring out of ESP.
... said Lauren on Jun 27, 2013 at 12:51 PM | link
Really nice, Greg.
WRT places like B-Spa showing a gain, I'm pretty sure that's about drawing from the countryside because you have the nearest supermarkets, hardware chain stores, auto parts, fast food, etc. Charting seven days instead of Monday-Friday -- while a different exercise -- would probably reveal retail-labor clusters more starkly. Where I grew up in rural Washington County, you had to go to Bennington or Mechanicville or Troy (at least) for big-ish stores. Now you can do some of that in Greenwich. Greenwich would probably be the color of Ballston Spa today, were this map bigger.
WRT Cohoes (city) and Water-vlee-eé being urban yet showing workday outflows, I'd say "urban" is a loose term that means too many things. I'm thinking these are bedroom communities that laborers and retail workers leave and come home to.
LQ
... said Lou Quillio on Jun 27, 2013 at 11:41 PM | link
Hey AOA - Perhaps it's time to revisit this article, but with the new ACS info and see if that prediction about Malta is true? (I'm betting it is.)
... said Ian Benjamin on Feb 7, 2018 at 11:38 AM | link