Capital Region high school graduation rates 2013
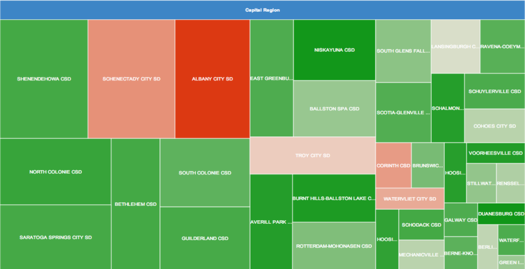
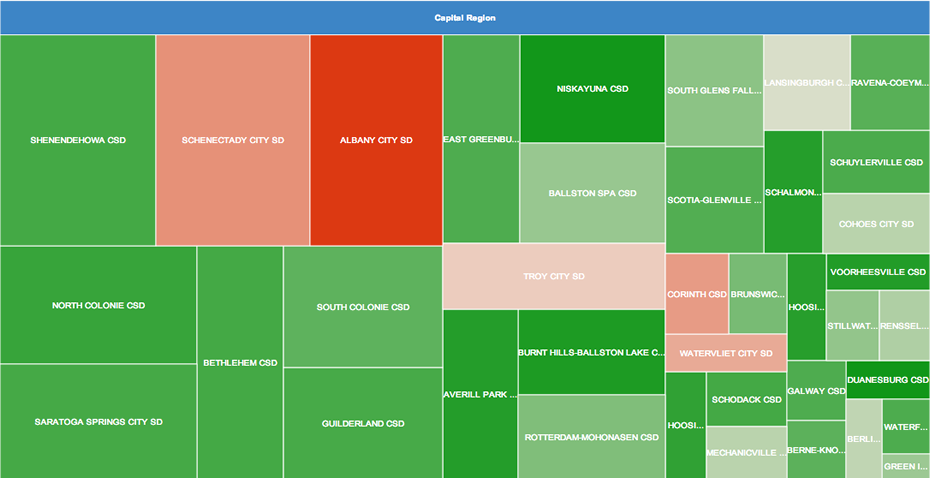
A "tree map" of how each Capital Region school district's high school class fit into the region's overall cohort. (Don't squint, there's a larger version after the jump.)
Corrected.
The state Department of Education recently released its annual collection of data about high school graduation rates around the state. The statewide graduation rate for 2013 (that is, the 2009 cohort of students) was 74.9 percent, up slightly from the year before. (That counts kids who finished up by June 2013).
As we do every year, we've pulled out the stats from Capital Region school districts.
Sorted stats (including notes and qualifications) after the jump.
A note about the data
"Graduation rate" in the tables below counts students from the 2009 cohort who graduated as of August 2013 (four school years plus one summer). "Dropped out" is students who did not get a degree, did not transfer to a GED program, did not get an IEP diploma, or are not still enrolled.
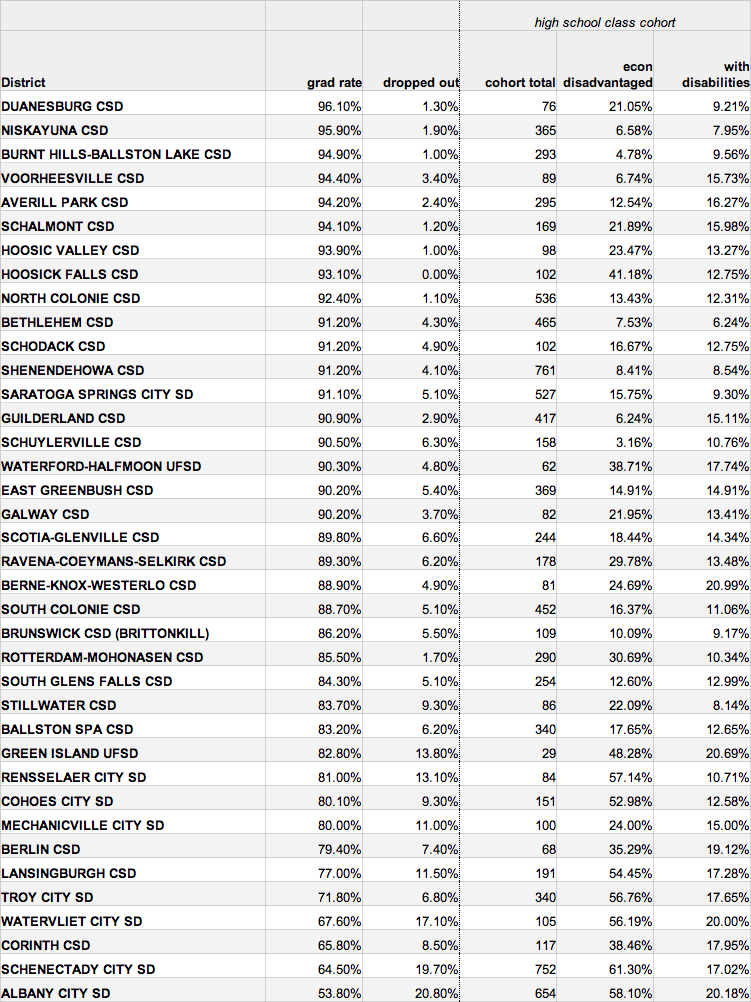
In years past when we've posted these rates, people have (rightly) brought up the issue of household income and the percent of students with disabilities as it relates to graduation rates. So we've included the percentage of students who were tagged as being economically disadvantaged or having a disability in each district's cohort.
NYSED defines (doc) "economically disadvantaged" as any student whose family is enrolled in at least one of a group of public assistance programs -- among them: free or reduced price lunch, food stamps, the earned income tax credit, the Home Energy Assistance Program. The disabilities category can include everything from physical disabilities to learning disabilities.
We've also included the size of the cohort because a managing a class of 90 students is probably a different challenge from managing one of 500.
All data is from NYSED. In some cases, percentages have been rounded.
Capital Region aggregate rates
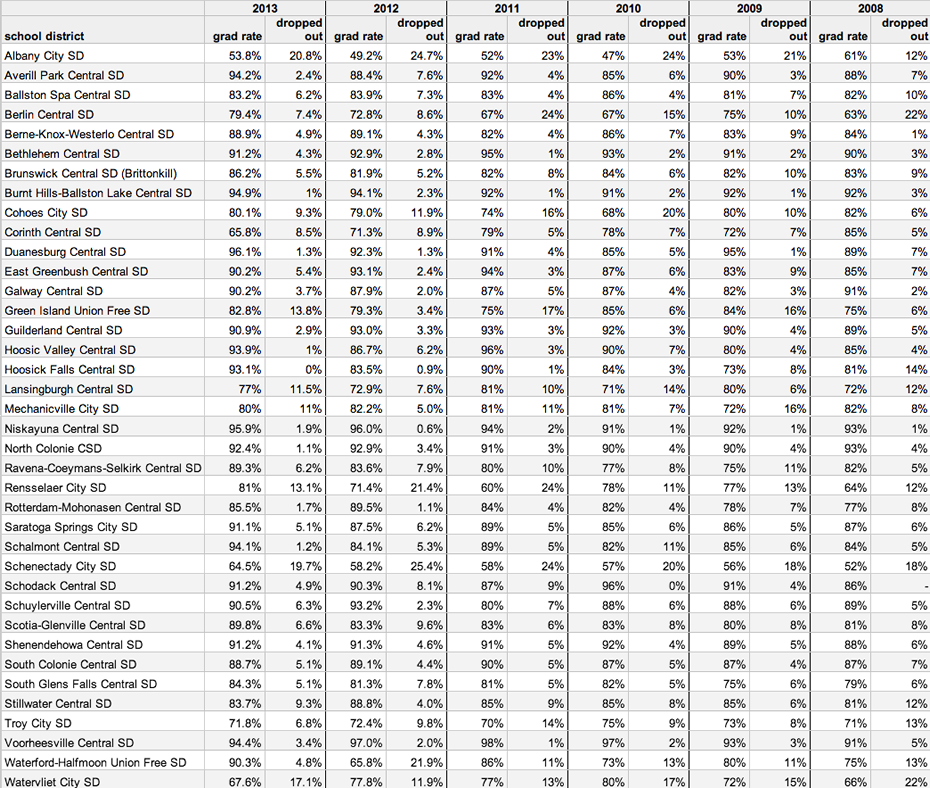
There are large-format tables above with rates and numbers for each district, both for 2013 and for previous years -- click or scroll all the way up.
An overview of all students in the region's four core counties:
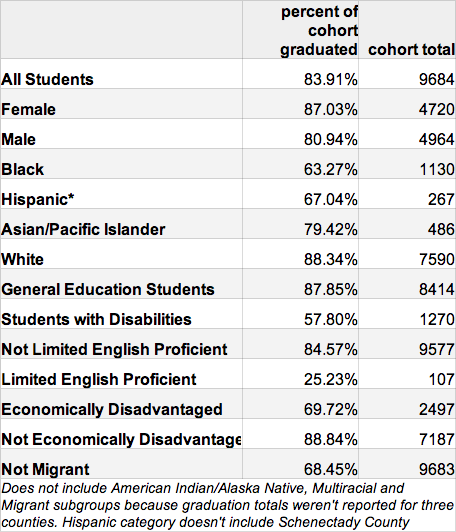
A few notes
+ Duanesburg takes the top spot this year with a rate of more than 96 percent. It was at about 92 percent the year before. But the district's cohort is small -- just 76 students for the 2009 cohort -- so a few students either way will have a relatively large effect on the rate.
+ Albany takes the bottom spot for the fifth year in a row. But its rate was about 50 percent (it had been 49 percent the year before). It's worth noting that the Albany school district also had cohort with the largest second largest percentage of students who are tagged as economically disadvantaged -- 58 percent. (Schenectady had the highest percentage of economically disadvantaged students -- 61 percent -- and had the second-lowest graduate rate.)
+ In previous years, people have asked about charter schools. Comparing Green Tech High and Albany Leadership to school districts is a bit of an apples and pears comparison, so we'll include the numbers here:
Green Tech High Charter School: 66.7 percent graduation rate / 1.5 percent dropped out / 66 student cohort
Albany Leadership Charter High School: 63 percent graduation rate / 0 percent dropped out / 27 student cohort
+ There continue to be large gaps between some some sub-groups of students in the Capital Region. For example: Students who were considered economically disadvantaged graduated at a rate 21 percentage points lower than students not considered economically disadvantaged.
Hi there. Comments have been closed for this item. Still have something to say? Contact us.
Comments
Go Falcons!
... said Tom on Jul 2, 2014 at 1:21 PM | link
How did you come up with the economically disadvantaged percentages? Pretty sure 25% of Niskayuna high school seniors are not on public assistance.
... said Ellen on Jul 2, 2014 at 4:04 PM | link
How is the number of students who move reflected in the data?
Also, Albany Leadership had only 63 kids and couldn't manage to graduate them all despite the fancy facility and cherry-picked population???? Shame.
... said lucy on Jul 2, 2014 at 6:05 PM | link
@Ellen: Thank you for catching that. I made an error when the sorting the table just before publishing it. The table has been corrected.
Thank you again.
... said Greg on Jul 3, 2014 at 9:43 AM | link
@lucy - Pretty high standard you're setting there. I don't think a 10-13% increase in graduation is anything to laugh at. Between both schools, that's 11 students that likely wouldn't have made it out of Albany High. Forget what you consider to be small gains for a minute, and think about the 11 lives that are now changed permanently, set on a new path of growth and fulfillment.
I know there are very large structural issues (poverty!) that need to be addressed to solve the education problem, but they aren't being fixerd anytime soon. I can't help but think that it's worth opening doors for those 11 children, while we figure out the big stuff.
You should also note the difference in dropout rates - ~21% for Albany City and 1.5%/0% for the charters.
And please stop with the cherry-picking students nonsense. It's untrue, illegal and if you have an actual example of it happenning, I beg you to report it!
... said Jay on Jul 3, 2014 at 9:52 AM | link
Thanks for the data breakdown. I saw these last week and had a question. According to the definition students who transfer schools would be considered drop outs. If a student transfers after freshman year it wouldn't likely be into a GED program. Is the district responsible for following up three years later to make sure the student earned a diploma? If that is the case the numbers could be negatively biased towards districts with more transient populations.
... said Laura on Jul 3, 2014 at 9:38 PM | link
AHS...graduate numbers will increase for the 2014-2015 school year...we the administration and staff are positive numbers will go up.
... said c. s. johnson (AHS) on Jul 4, 2014 at 12:44 PM | link
where is albany leadership ?
... said megan on Jul 16, 2014 at 7:09 PM | link