Living in the "unhappy" belt

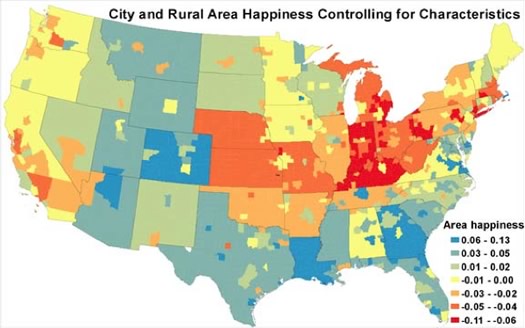
A map from the paper. It represents life satisfaction for metro and rural areas after adjusting for demographic variables.
Are you happy living here? Would you be happier if you lived somewhere else?
The Albany area ranks #142 out of 318 metro areas in self-reported life satisfaction, according to a working paper recently released by a research team headed by a Harvard economist.* The Albany metro is planted within a belt of "unhappy" cities that stretches from Massachusetts and through the northern US into the Midwest. Other upstate cities fare worse. And New York City was ranked as the #1 unhappy city.
OK, but what do they mean by "unhappy"? In this case the researchers are basing happiness in part on answers people gave to a large, national survey conducted by the CDC that asks people: "In general, how satisfied are you with your life?" Possible answers: very satisfied, satisfied, dissatisfied, and very dissatisfied. The researchers used the answers as a proxy for happiness, and then controlled the results for a handful of factors. (So, you know, there are a few grains of salt that could be applied here.)
Here's a good look at the study by the Washington Post's Wonkblog, which also has a clickable map.
The paper includes some interesting discussion about whether declining cities were always unhappy or have become that way because they're declining (the researchers figure they cities were probably unhappy to start), and why people stay in unhappy places (higher wages or lower rents).
But the most interesting idea, to us, was one about how/why cities have developed or been designed. A clip about that is after the jump:
We initially built cities in places where firms had a productive advantage because of proximity to waterways and coalmines. Moreover, we also built those cities in ways that favored productivity rather than pleasure. Over time, declining transport costs enabled capital and labor to flee low amenity places (Glaeser and Kohlhase, 2006) and move to "consumer cities" endowed with higher amenity levels (Glaeser, Kolko and Saiz, 2001). An increasingly wealthy population also built new cities that were more oriented towards consumer well-being.
Within the context of the model, this can be understood as a change in the covariance between productivity and the amenity parameters. In early 20th century America, productivity may have been higher in lower amenity places but in late 20th century America, that negative covariance disappeared. As a result, population growth was faster in places that had higher amenities initially and lower levels of productivity.
This argument provides a slightly different interpretation of the Easterlin (1974) result, at least insofar as it applies to America's metropolitan areas. In the early part of the 20th century, a city needed to be unpleasant to be productive. In the late 20th century, it did not. Since technological change favored pleasant, happier locales, it seemed as if happiness was tied to income growth, even if it was ultimately driven by the local environment.
Map from Glaeser, Edward L. and Gottlieb, Joshua D. and Ziv, Oren, Unhappy Cities (July 2014). NBER Working Paper No. w20291. Available at SSRN: http://ssrn.com/abstract=2471184
* The rank is via the Wonkblog post.
Earlier on AOA:
+ If you could move from New York, would you?
+ Where people moved to/from when moving from/to the Capital Region
+ Study: New York is at the heart of the nation's "temperamental and uninhibited" region
Say Something!
We'd really like you to take part in the conversation here at All Over Albany. But we do have a few rules here. Don't worry, they're easy. The first: be kind. The second: treat everyone else with the same respect you'd like to see in return. Cool? Great, post away. Comments are moderated so it might take a little while for your comment to show up. Thanks for being patient.
... said KGB about Drawing: What's something that brought you joy this year?