How New York and the Capital Region compare on income inequality
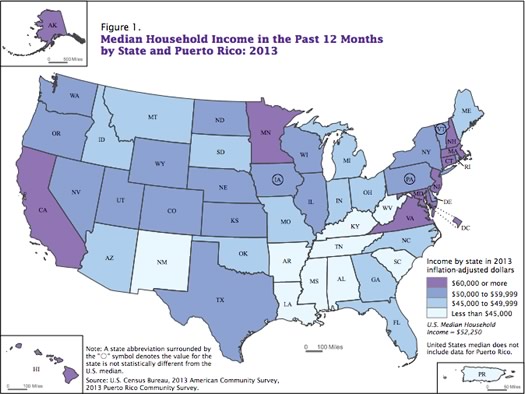
States by median household income in 2013. / map: US Census Bureau
Income inequality has been a much-discussed topic over the last few years, so some new numbers about income -- and income inequality -- out this week from the Census Bureau caught our eye.
As part of the income data from the 2013 American Community Survey, the Census Bureau released Gini coefficients for various places -- these numbers are the result of calculation intended to give a sense of how income is distributed within a group of people, usually a nation. It's a very common of income inequality when comparing countries.
So we were curious to see how New York -- and the Capital Region -- compared to the rest of the nation...
A quick note: The Gini Index ranges from 0 to 1. At 0, it means that every household has exactly the same level of income. At 1, it means that all the income is going to just one household and everyone else is getting nothing.
The Gini Index does not necessarily speak to levels of income. For example, populations where everyone is either similarly very rich or similarly very poor would both have low Gini indexes.
New York State
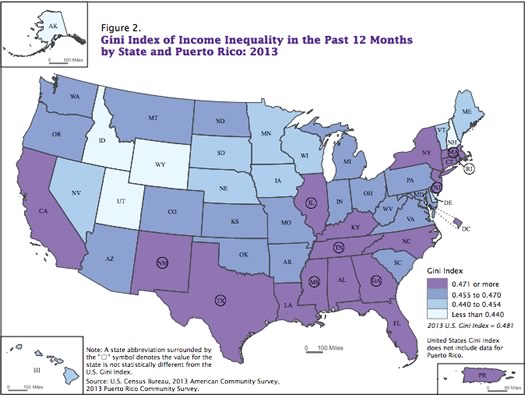
First, how New York State stacks up against other states (and Puerto Rico). The map above is from the Census Bureau. As you can see, New York has one of the highest Gini Indexes in the nation.
In fact, the Empire State's .5098 index (0.0035 margin of error) ranks third highest in the nation for income inequality. (The nation's Gini Index was estimated to be 0.481.)
New York's high ranking is probably in part a result of the contrast between New York City (where some people enormous amounts of money) and upstate (where many people don't).
For some in-state perspective, here's a clickable map of NYS counties for which the Census Bureau calculated a Gini index for 2013. (It includes counties with populations of 65,000 or more.)
The downstate counties lean toward the upper end of the index. And Manhattan really leans that way -- its index is .6012.
The Capital Region
So where does the Capital Region stand compared to the rest of the country? Here's another clickable map, this time of metro areas with more a 2013 estimated population greater than 500,000. The metros are shaded according to their Gini Indexes.
Compared to these other large metros, the Capital Region's income distribution is very much toward the more equal end of the spectrum. In fact, the Capital Region's Gini Index (.4403 - margin of error .0097) ranks as roughly 10th lowest among large metros.
(Why? Good question. Maybe something we'll dig into later. Quick guess right now: The Capital Region doesn't rank highly among large metros for poverty rate. And while there are people doing pretty well here, there probably aren't the numbers of super rich people as in some of the very large metros.)
There's a sortable table above in large format -- click or scroll all the way up.
The Capital Region's index contrasts greatly with that of New York City, which is the second highest in the nation. (The highest: Bridgeport-Stamford-Norwalk, CT Metro Area.)
More Capital Region bits
2013 estimated total population: 877,905
2013 estimated median household income: $59,626 (78th percentile among large metros)
2013 estimated poverty rate: 12.5 percent (19th percentile among large metros)
In this case, "large metros" means metro areas with more than 500,000 total population.
Say Something!
We'd really like you to take part in the conversation here at All Over Albany. But we do have a few rules here. Don't worry, they're easy. The first: be kind. The second: treat everyone else with the same respect you'd like to see in return. Cool? Great, post away. Comments are moderated so it might take a little while for your comment to show up. Thanks for being patient.
... said KGB about Drawing: What's something that brought you joy this year?