A snapshot of Capital Region income
How the Albany-Schenectady-Troy metro compares to the nation's 381 other metro areas.
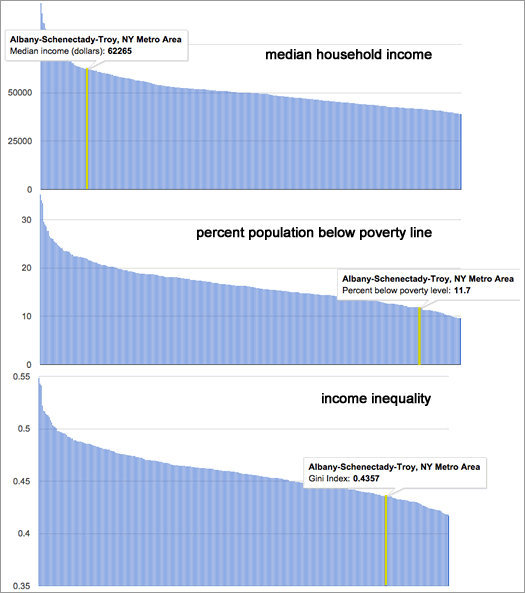
The Albany metro area continues to have one of the nation's higher median household incomes, and one of the the lower rates of poverty, according to the newest estimates from the Census Bureau.
Household income
The median household income in the Albany metro -- the point at which half the households had more income, and half had less -- was an estimated $62,265 (+/-1,494) in 2014. That's up just a bit from 2013 -- $59,626 (+/-1,981) ($60,593.25 in 2014 dollars). And it ranks 41st among the 381 metropolitan statistical areas the Census tracks.
Poverty rate
The Albany metro area's poverty rate was an estimated 11.7 percent (+/- 0.9). (It was 12.5 percent (+/-1.0) in 2013.) The metro's poverty rate was the 51st lowest among the 381 metros, lower than 87 percent of them. The Capital Region's poverty rate for kids wasn't quite so low -- an estimated 17.1 percent (+/-2), lower than 76 percent of metros.
Income inequality
Another angle on income and poverty is income inequality. And for that the Census Bureau publishes a figure called the Gini index -- a Gini index of 1 means only person has all the income, and 0 means everyone in a group has the same level. The Capital Region's Gini index for 2014 -- an estimated .4357 (+/-0.0119) -- was the 80th lowest (that is, toward the more equal end) among metropolitan areas.
Even if those three measure look relatively good for the Capital Region, there are still some troubling parts to the picture.
County map
The estimates released this week by the Census Bureau cover places with populations of 65,000 or more. So, we also pulled the numbers for New York State counties that reach that threshold and mapped them. (The counties missing from the map didn't meet the population threshold.)
The maps are above in large format -- click or scroll all the way up.
By the way: Among counties outside the greater New York City area, Saratoga County had both the highest estimated median household income and lowest estimated poverty rate.
Not all great up close
Dig into this latest batch of estimates a bit and there are some troubling aspects.
Pockets of poverty, especially child poverty
Within the Capital Region there are pockets of relatively high poverty, notably in the cities of Albany and Schenectady. The portion of people under the poverty line in Albany was estimated to be 29 percent (+/-4.6) in 2014. And in Schenectady it was 20.3 percent (+/-4.7 percent).
The numbers are especially stark for child poverty. In Schenectady an estimated 33.4 percent of kids 18 and under were in poverty (+/-14.7). And in the city of Albany it was 50.3 percent (+/-11.7).
That number for Albany is especially glaring. Though it's important to keep in mind these are one-year estimates with relatively large margins of error. Albany's poverty rate for children was reported to be 25.4 percent (+/-9.6) in 2013, so the 2014 number could be a statistical blip. But even if it's half that rate -- it's still sobering.
Albany and Schenectady are the only local cities that are above the 65,000 population threshold. The town of Colonie also qualifies -- its poverty rate was 6.8 percent (+/-2.3).
Racial disparities
Another notable aspect is the racial disparity for income and poverty. The median income for white households in the Albany metro area was $65,698 (+/-1,709) in 2014 -- and $31,704 (+/-3,070) for African-American households.
The poverty rate for whites was 8.9 percent (+/-0.7) -- but it was 28.4 percent (+/-5.3) for African Americans, 19.3 percent (+/-7.2) for Asians, and 25 percent (+/-5.9) for people who identified themselves as Hispanic or of Latino origin. (Hispanic/Latino origin is a category separate from race for the Census.)
... said KGB about Drawing: What's something that brought you joy this year?