Jump to the main section.

Numbers are via the 2015 Census population estimates.

Recent population trend for top 10 population states

2015 top10 population states trends graph

States by total population, 2015 estimates

States by estimated population change percentage, 2014-2015

States by estimated average annual net migration rate, 2010-2015

Net migration rate is the estimated number of people who moved in/out the state per 1,000 population.

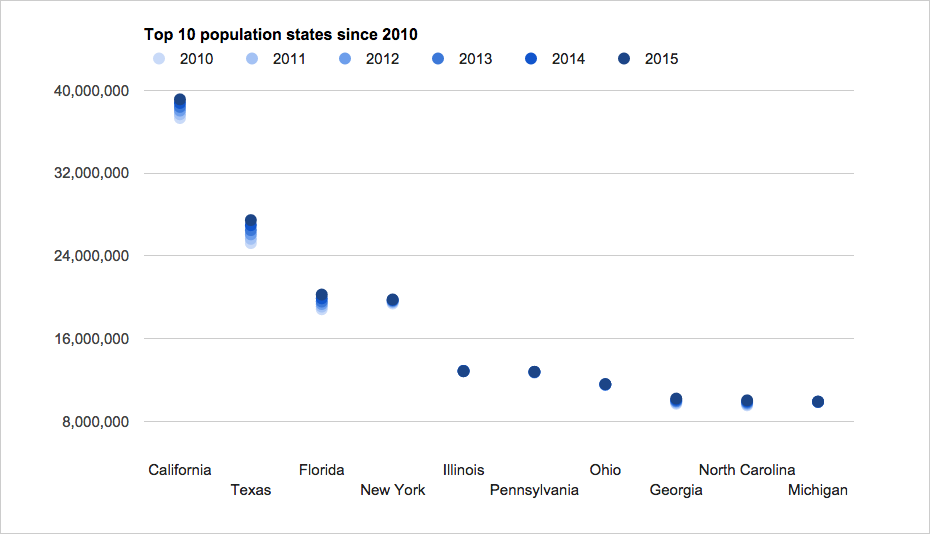
New York State is #4 -- again

2015 top4 population states trends graph

It's not looking good for catching Florida anytime soon.

The Census Bureau released new state population estimates this week and the Empire State was pegged at 19,795,791 people as of July 1, 2015. That's up an estimated 46,933 from the same point in 2014, an increase of .25 percent.

But that small increase wasn't enough for New York to catch back up with Florida, which passed New York for the #3 spot in the national population ranking last year. Florida's population grew an estimated 1.84 percent between July 1, 2014 and July 1, 2015.

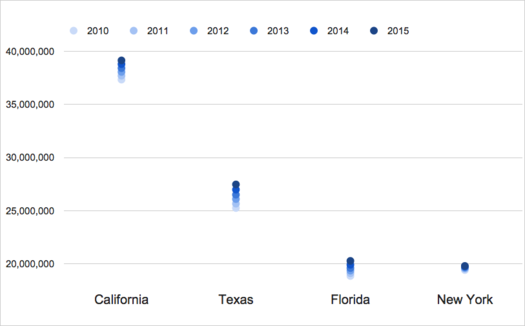
And that's the overall story for New York's population -- it's growing, but very slowly, especially compared to California, Texas, and Florida. The Empire State's population is up an estimated 2.02 percent between 2010 and 2015. But over that same period California is up 4.85 percent, Texas is up 8.81 percent, and Florida is up 7.54 percent. (The graph above illustrates the change for each state since 2010.)

The drag on New York's overall population growth is that it's losing a relatively large number of people each year to other states. It lost an estimated 628,672 people between July 1, 2010 and July 1, 2015 to what the Census calls domestic migration.

So, what's propping up New York's population? People coming to the state from outside the United States -- international migration to New York is an estimated +606,667 between 2010 and 2015. And New Yorkers are having babies at a much faster rate than people here are dying -- New York is an estimated +441,603 over that same period for births and deaths.

There are a handful of clickable national maps (and another graph) after the jump. Because of course there is.

Maps and graph

Above in large format -- click or scroll all the way up.

The Scoop

For a decade All Over Albany was a place for interested and interesting people in New York's Capital Region. It was kind of like having a smart, savvy friend who could help you find out what's up. AOA stopped publishing at the end of 2018.

Recently on All Over Albany

Thank you!

When we started AOA a decade ago we had no idea what was going to happen. And it turned out better than we could have... (more)

Let's stay in touch

This all feels like the last day of camp or something. And we're going to miss you all so much. But we'd like to stay... (more)

A few things I think about this place

Working on AOA over the past decade has been a life-changing experience for me and it's shaped the way I think about so many things.... (more)

Albany tightened its rules for shoveling snowy sidewalks last winter -- so how'd that work out?

If winter ever gets its act together and drops more snow on us, there will be sidewalks to shovel. And shortly after that, Albany will... (more)

Tea with Jack McEneny

Last week we were fortunate enough to spend a few minutes with Jack McEneny -- former state Assemblyman, unofficial Albany historian, and genuinely nice guy.... (more)

Recent Comments

My three year old son absolutely loving riding the train around Huck Finn's (Hoffman's) Playland this summer.

Thank you!

...has 27 comments, most recently from Ashley

Let's stay in touch

...has 4 comments, most recently from mg

A look inside 2 Judson Street

...has 3 comments, most recently from Diane (Agans) Boyle

Everything changes: Alicia Lea

...has 2 comments, most recently from Chaz Boyark

A few things I think about this place

...has 13 comments, most recently from Katherine