One thing that sticks out about prices here

You might have seen that map floating around online recently about "the real value of $100 in each state" -- and New York State had one of the lowest "real" values of any state.
That map was based on figures published by the federal Bureau of Economic Analysis. And one of those figures is something called the regional price parities (RPPs) -- an attempt to measure how much goods and services cost in an area compared to the rest of the country.
You can probably now guess why the state level number for New York is kind of misleading -- if you're lumping in numbers for New York City with numbers for, say, Utica, it's going to be skewed. And to the credit of the think tank that made that state map -- the Tax Foundation -- it followed up this week with a similar map based on metro areas.
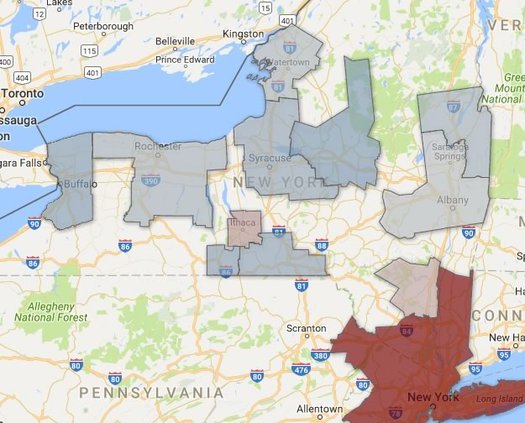
Anyway, this is just a long setup for looking at RPPs for metro areas around New York State. There's a static map above for the RPPs for all items across the state's metro areas -- and a clickable map after the jump. And as you can see, most parts of upstate have prices that are about average for the nation -- or lower.
Which is probably what you might expect -- except for one category...
Quick overview of regional price parities
Regional price parities are, as explained by the feds, "determined by the average prices paid by consumers for the mix of goods and services consumed in each region." And they're an index. So RPP of 100 is equal to the average for the whole country -- the lower the number for an area, the lower the prices, the higher the number for an area, the higher the prices.
The most recent set of RPPs -- for the year 2014 -- was published this past July.
Map: New York State metros RPPs all items
Here's that clickable map of the RPPs for all items across metro areas in New York State.
Map: RPPs rents
Across upstate, the average price of goods and services in these figures is roughly the same -- except for rents. And the Ithaca, Kingston, and Albany metros stick out for their relatively high rents (Albany less so). In fact, most of the variation in RPPs across upstate is due to rents.
The Albany metro area's RPP for rents is 104.9 -- so it's about 5 percent higher than the national average. And it stands out a bit from its other prices, for goods (97.8) and other services (97.9).
Ithaca has a very high RPP for rents: 132.3. And maybe that has something to do with being a small area with a large relatively large college population. And Kingston (125.8) is probably seeing the effects of the New York metro spreading northward.
But Albany? That's a little bit harder to figure. There are a fair number of college students here. And, as commenters have pointed out in the past, there do seem to be a chunk of people who move here for relatively short time spans for work, whether because of state government or other projects here. But we're curious if there are other reasons. It's something to look into.
By the way: The median gross rent paid in the Albany metro area in the latest Census Bureau estimates (2014 5-year estimates) was $905 -- that is, of renters here, the Census Bureau estimates half are paying more and half are paying less per month. And for almost 40 percent of renters, their monthly rent represented 35 percent or more of their monthly household income.
New York metro RPPs
Earlier on AOA
+ Getting some sense of New York's upcoming minimum wage increases
... said KGB about Drawing: What's something that brought you joy this year?