Capital Region rent, relatively speaking
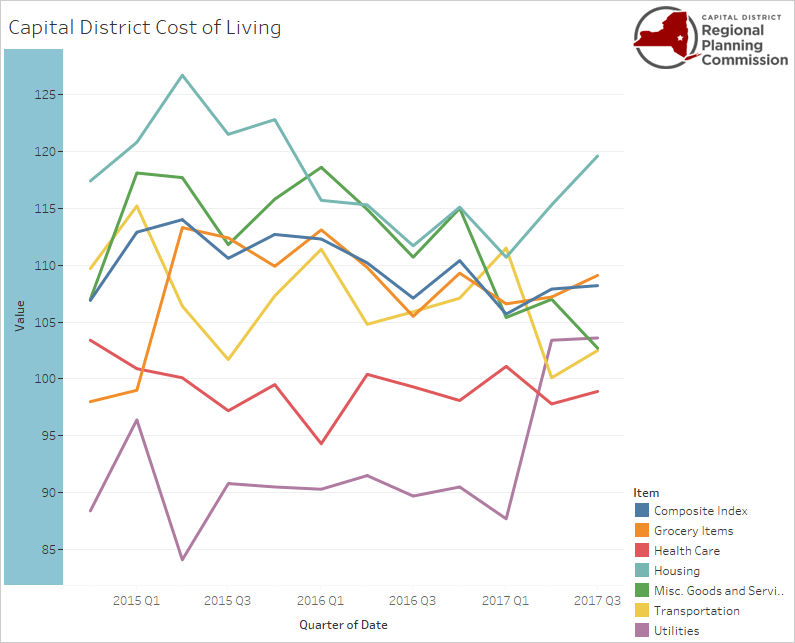
This graph is from the Capital District Regional Planning Commission and the Council for Community and Economic Research. It tracks a Capital Region cost of living measure relative to the national average quarter by quarter. That teal line running along the top is the cost of housing.
Speaking of residential develop and rents and related whatnot...
+ The median gross rent for Albany-Schenectady-Troy metro area was $931 (+/-21) in 2016, according the Census Bureau*. In the city of Albany it was $895 (+/-29). That is, half the rents (plus utilities if not included) were above that mark and half were below.
+ In 2007, the median gross rent for the Albany metro was $779 (+/-18) and for the city of Albany $746 (+/-37). The 2016 rent levels mentioned above are an increase of almost 20 percent in both cases. That increase outpaced general inflation for the United States -- if both had risen at the pace of general inflation, they would have been at $900 and $862.**
+ Between 2007 and 2016, median household income for the Albany metro increased a little more than 19 percent to $65,855 (+/-2,050), according to the Census Bureau.*** For the city of Albany, the increase was a little more than 13 percent, to $42,302 (+/-3,456).
+ The federal government tracks a measure called Regional Price Parities that's used to compare to the cost of broad categories of items between different parts of the country. For 2015, the latest year available, the RPP for the Albany metro area was 99.7. (The national average is 100.) But for rents it was 105.1, indicating rents were about 5 percent more expensive here than the national average.
+ A similar measure tracked by the Capital District Regional Planning Commission and partner orgs pegs the cost of living in the Capital Region at about 8 percent higher than the national average for the third quarter of 2017. But the cost of housing was pegged at almost 20 percent higher than the national average.
____
* American Community Survey 1-year estimates.
** According to the federal Bureau of Labor Statistics consumer price index inflation calculator.
*** American Community Survey 1-year estimates.
Earlier:
+ Thinking about affordable housing in Albany
... said KGB about Drawing: What's something that brought you joy this year?