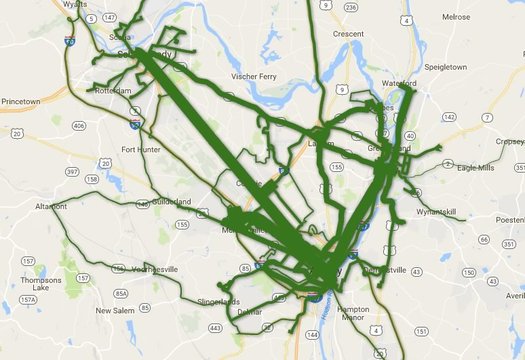
The Capital Region's transit arteries

Total ridership per route during the last fiscal year. Is there a clickable, zoomable map inside? You know there is...
Which CDTA bus lines get the most riders?
The news earlier this year that CDTA set another annual ridership record -- and the recent batch of service changes on some of its most popular routes -- got us curious about ridership across the whole CDTA system.
So, of course, we had to make some clickable maps. Let's have a look.
Maps and a table above
This post is basically a few maps and a table -- click or scroll all the way up for them.
A few quick things
+ These numbers are from CDTA's route performance report for fiscal year 2015 April 1-2016 March 31.
+ Some of the routes in the table above have ridership per revenue figures that are below CDTA's set performance thresholds for each type of route. For trunk routes it's 25 rides per hour, express 20 rides per hour, neighborhood 15 rides per hour, and commuter 12 rides per hour. "Routes that fall below acceptable thresholds are considered for corrective actions and assessments of promotional opportunities to increase usage. Routes that exceed the range for a category, or perform well above average, are examined to determine if a change in category is warranted, or if a route restructuring is advisable."
+ One of the recent service changes CDTA made was increasing the frequency of the #12 Washington Ave in Albany to every eight minutes during the afternoons. And it's not hard to see why based on the numbers -- it's #2 in rides per revenue hour in the whole system (and not far behind #1).
+ CDTA has been planning to expand BusPlus to include two more lines -- one along the Western/Washington corridor in Albany ("the purple line"), and one between Albany and Troy ("the blue line"). And a quick glance at the maps will start suggest why those corridors are the focus.
____
Earlier on AOA
+ Thinking about Capital Region light rail
... said KGB about Drawing: What's something that brought you joy this year?