Items tagged with 'nerding out'
Here's when the seasons really start and end in the Albany area*
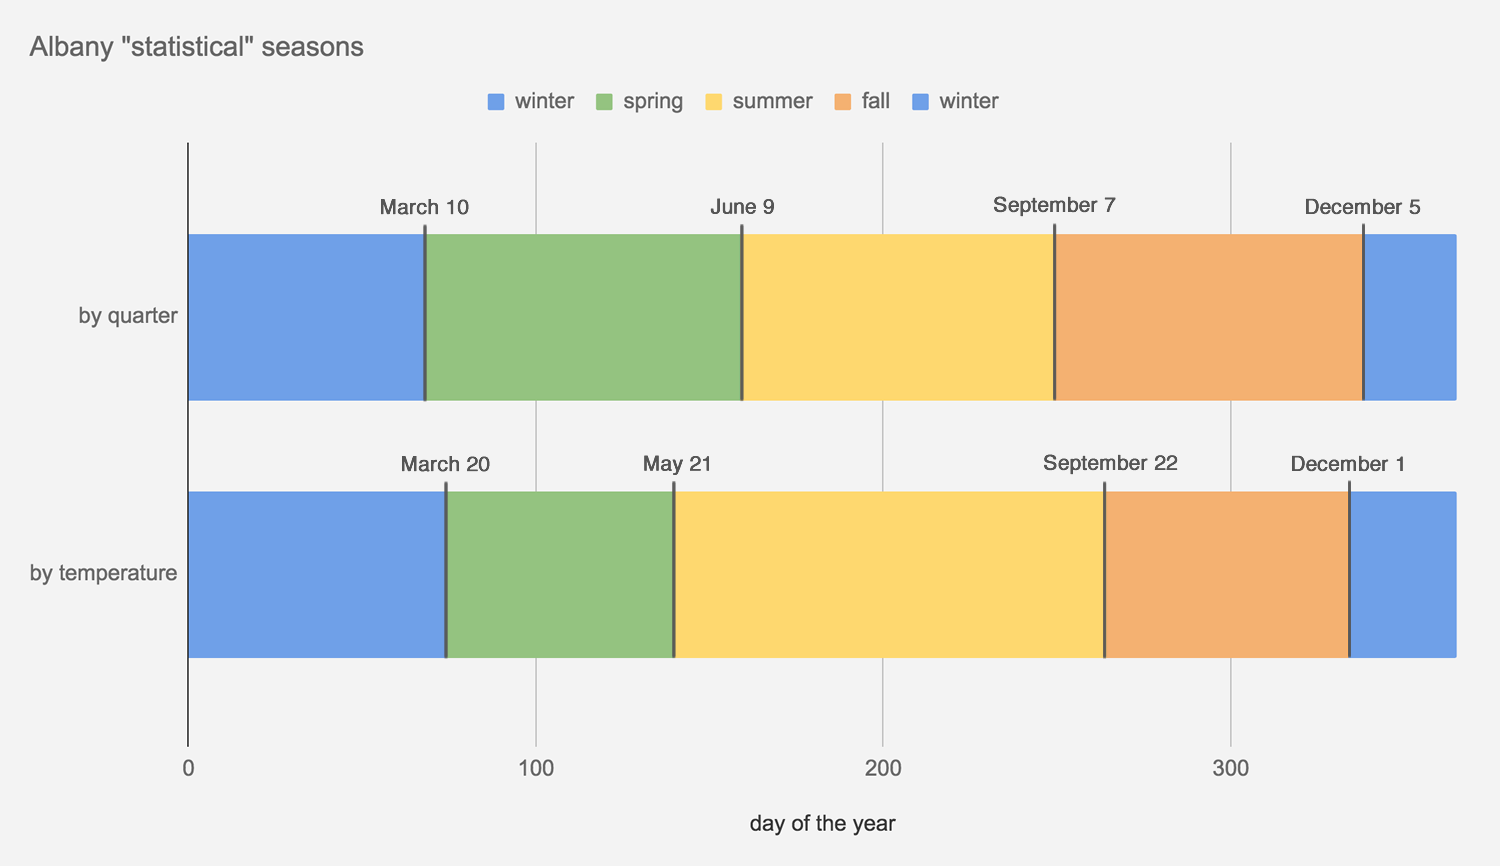
* On average. And by these definitions, which are just one or two ways of looking at this topic. Really, it's winter whenever you decide to switch to the big coat and put the shovel in the car. | Also: Here's a larger, easier-to-read version of this graph.
Winter starts December 21 -- by the astronomical definition. And it starts December 1 by -- the meteorological definition.
But when does it really start in Albany?
Inspired by a chart and discussion on Twitter today attempting to mark the start of seasons in various places around the country based on normal temperatures, we figured it'd be interesting to look at the daily temperatures in Albany in order to define what you might call the "statistical" seasons. That is, when the seasons start based on what the temperatures actually are and not what the calendar says.
Of course, you can interpret numbers all sorts of ways. And in this case we ended up doing it two ways:
+ Breaking the year up into (roughly) four quarters according to normal temperatures. Winter's the coldest 25 percent of the days each year, summer's the warmest 25 percent, and spring and fall are what's in between. Looking at it this way, winter starts December 5 and lasts until March 10.
+ Looking at the distribution of temperatures here throughout the year and defining winter and summer as the days when temperatures are either in the bottom or top 25 percent of the distribution. Spring and fall are everything in between. Looking at it this way, winter starts December 1 and lasts until March 20.
And: See resulting chartage above. Don't worry, we've included a larger version here, along with a bonus graph.
Here's a bit more explanation and weather nerding...
Those odd clouds, and a handful of rainbow pics
Follows by some odd clouds pic.twitter.com/cWWH5LZLDA
— Basil Seggos (@BasilSeggos) October 23, 2018
Tuesday's late afternoon thunderstorm created some fantastic rainbows around the area. And while you were gawking at the prismatic display, you might have also noticed some odd-looking clouds -- a sort of formation we don't see very often around here.
It caused local weather nerds to have a moment. See this thread over on the National Weather Service Albany Facebook page in which people shared all sorts of photos.
Here's a quick overview of what exactly those were, and a bunch of bonus rainbow pics...
Map quiz: A creek by another name
What's the name?
For the last however many years we've posted a map quiz this time of year -- and here's this year's...
A bunch of creeks and streams in the Capital Region and the Hudson Valley are called "kills" because of the Dutch influence in this area. ("Kill" roughly means "creek" in Dutch.)
So this year's map quiz -- a quick seven multiple choice questions, with maps! -- tests your knowledge of these creeks by another name.
Plus: There's a bonus, clickable map of these many waterways...
The recipe for a thunderstorm
You no doubt know Jason from his many years as a meteorologist on TV here in the Capital Region. He's helping us nerd out on some local weather stuff. Got a question about how local weather works? Send it along!
I was an on-air meteorologist for 17+ years and during that time I visited over 200 schools to give weather talks. The most frequently asked question was: "Why/how did you get in to meteorology?"
The answer is simple: thunderstorms.
Damn things used to freak me out, especially at night. You're like six years old, the whole room lights up and then, BOOM. No, thank you. Didn't want any part of that mess.
But one day my father took me down to the main branch of the Albany Public Library to learn about thunderstorms, and that's exactly what I did. I quickly found out how simply amazing thunderstorms are. And by the way, so is the rest of our weather.
I was hooked, and always will be.
So, let's talk about the weather this spring
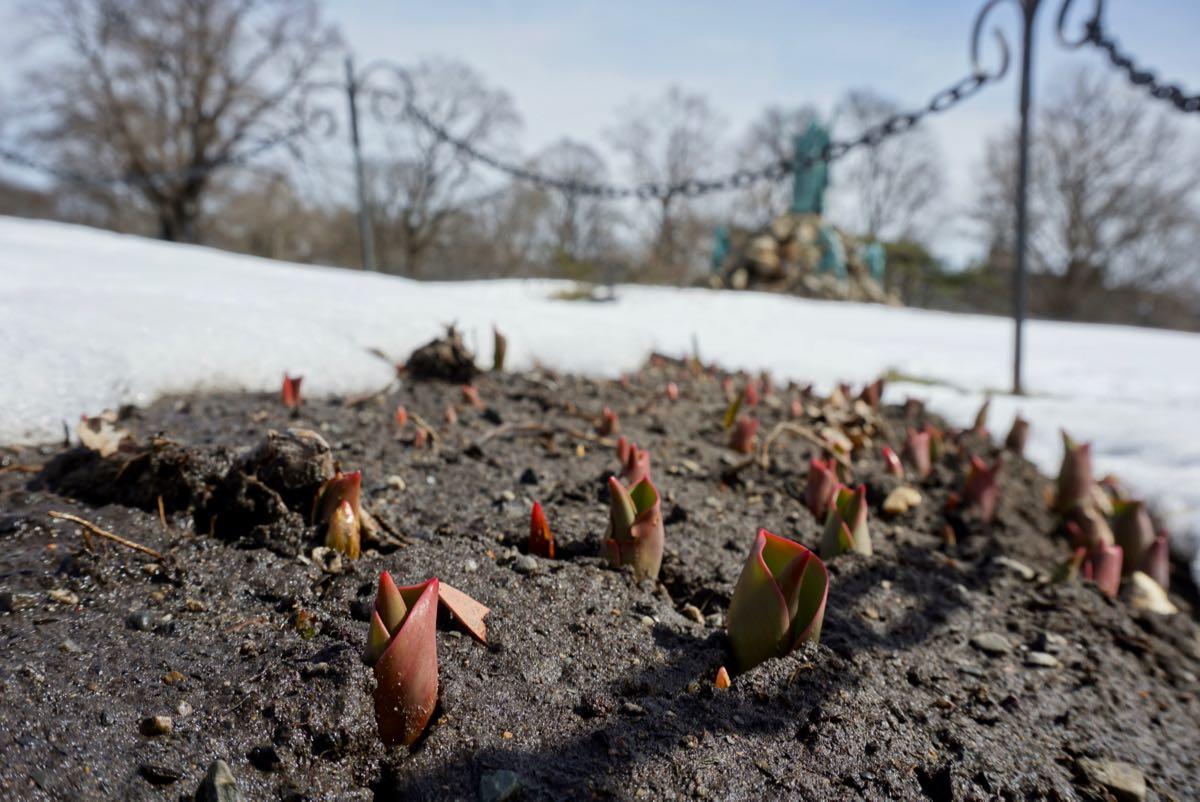
The tulips got a slow start this spring.
You no doubt know Jason from his many years as a meteorologist on TV here in the Capital Region. He's helping us nerd out on some local weather stuff. Got a question about how local weather works? Send it along!
"WHAT THE HELL'S GOING ON OUT HERE!!" - Vince Lombardi
"Spring, my dimpled tookus". - Jason Gough
OK, we know this spring is the pits, but just how many pits are we talking here?
Before we take a look at some hard numbers to right the ship of despair that is spring 2018, let's look at the bigger picture.
Nor'easters and model behavior
March was just... very gray.
We're happy to welcome Jason Gough to AOA as a contributor. You no doubt know Jason from his many years as a meteorologist on TV here in the Capital Region. He's helping us nerd out on some local weather stuff. Got a question about how local weather works? Send it along!
Last time we spoke it was about "the models," the complex sets of atmospheric models meteorologists use to make predictions about the weather -- some of the history behind them, what goes into them, what makes them imperfect. And I promised at the end we'd get to how we use those models to make a final forecast and the ongoing competition between the Americans and Europeans.
Since that time, well, it's not been the best March in recent memory. Our highest temperature of the month was 56 degrees, and that was on the last day of the month. We also had our share of snow -- enough to make into the top 10 of snowiest Marches on record. That snow was not easily forecasted. And it piled up. A few times.
So let's starting off talk about the first Nor'easter of the month and the forecasts for it.
Very well acquainted, too, with matters mathematical, they are the very model of a modern forecast meteorological
Sometimes the models can't agree on what the picture's going to look like.
We're happy to welcome Jason Gough to AOA as a contributor. You no doubt know Jason from his many years as a meteorologist on TV here in the Capital Region. He's going to help us nerd out on some local weather stuff. Got a question about how local weather works? Send it along!
If you watched me over the years for your weather forecasts on even a semi-regular basis -- and thank you if you did! -- you may have noticed that when winter storms came into the mix, you heard something like: "I'm tracking the storm, but the models don't agree on things just yet. Still a few days to sort it all out."
The models? What's that all about?
A few spots around the Capital Region for watching the eclipse
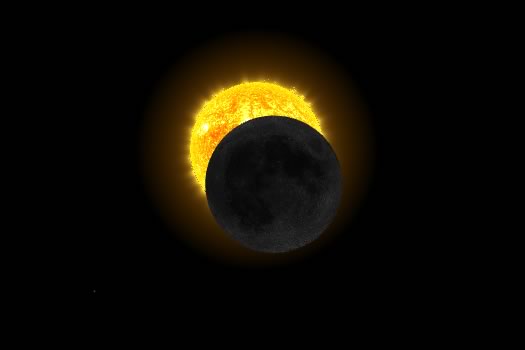
A simulation of what the eclipse will look like at its maximum coverage here. It's from NASA's "Eyes on the Eclipse" online app, which is fun to play with.
Updated
As you've no doubt heard, the moon is going to get between the Earth and the sun Monday, casting its shadow across this part of the world. And though the Capital Region isn't in (movie trailer voice) THE PATH OF TOTALITY, we will see a partial eclipse between 1:22 pm and 3:56 pm (maximum eclipse at 2:42 pm).
If it's not cloudy, you'll be able to see what's happening -- while wearing proper eye protection -- from anywhere with a clear view of the sky. But it might be more fun to see it with other people, some of whom can explain exactly what's happening. (Luna's throwing shade. That's what's happening.)
So here are a few of those places to catch the eclipse in the Capital Region...
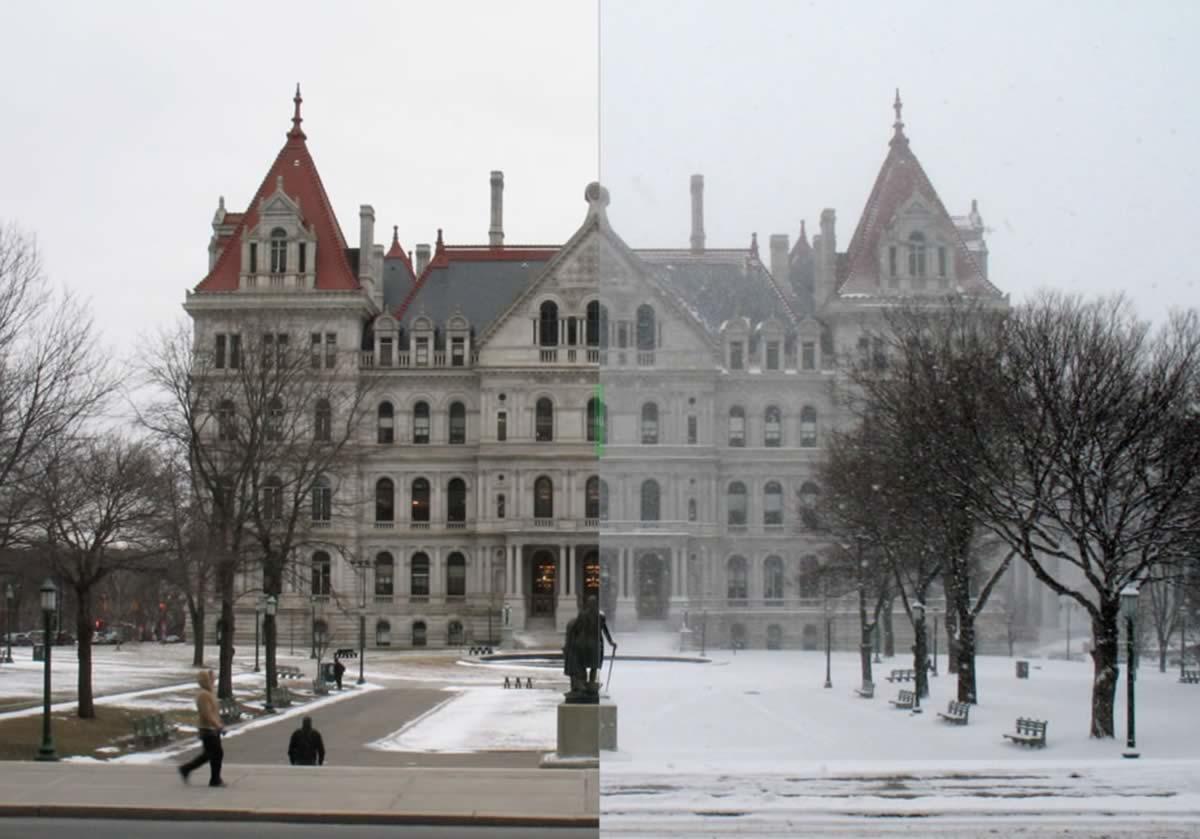
Why is this a "blizzard" and not just a big snowstorm?
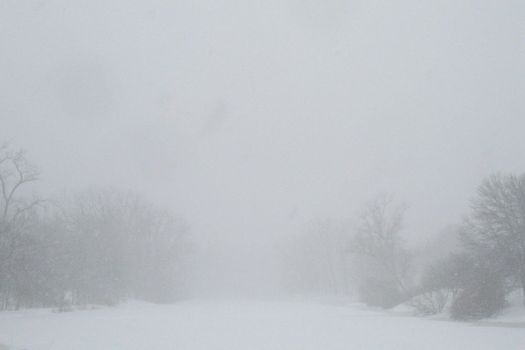
Visibility: low.
In most winters around here, we get at least a few big snowstorms, with a foot or more of snow. But they're not blizzards.
This week's storm? It's been tagged as a blizzard.
So... why is that?
Open Data Day hackathon at TVCOG
 The Tech Valley Center of Gravity in Troy is hosting an Open Data Day hackathon this Saturday, March 4. Blurbage:
Open Data Day is a collection of local gatherings of open government advocates, developers, programmers, statisticians, and citizens who want to build things with and promote the use of open data. ... Join us at Tech Valley Center of Gravity from 9AM to 3PM! In addition to a hackathon, we're planning quick talks and workshops to introduce participants to the concepts and tools essential to working with open data.
We hear from organizer Ursula Kaczmarek that there's still some space left for people who'd like to participate. Also: "The event is free and we'll provide all the coffee and sugary snacks people need to participate."
Here's how to register.
Access to public information is becoming a modern civil right. Finding ways to make this sort of info easier to access and use for all sorts of people is a worthy goal.
TVCOG advertises on AOA.
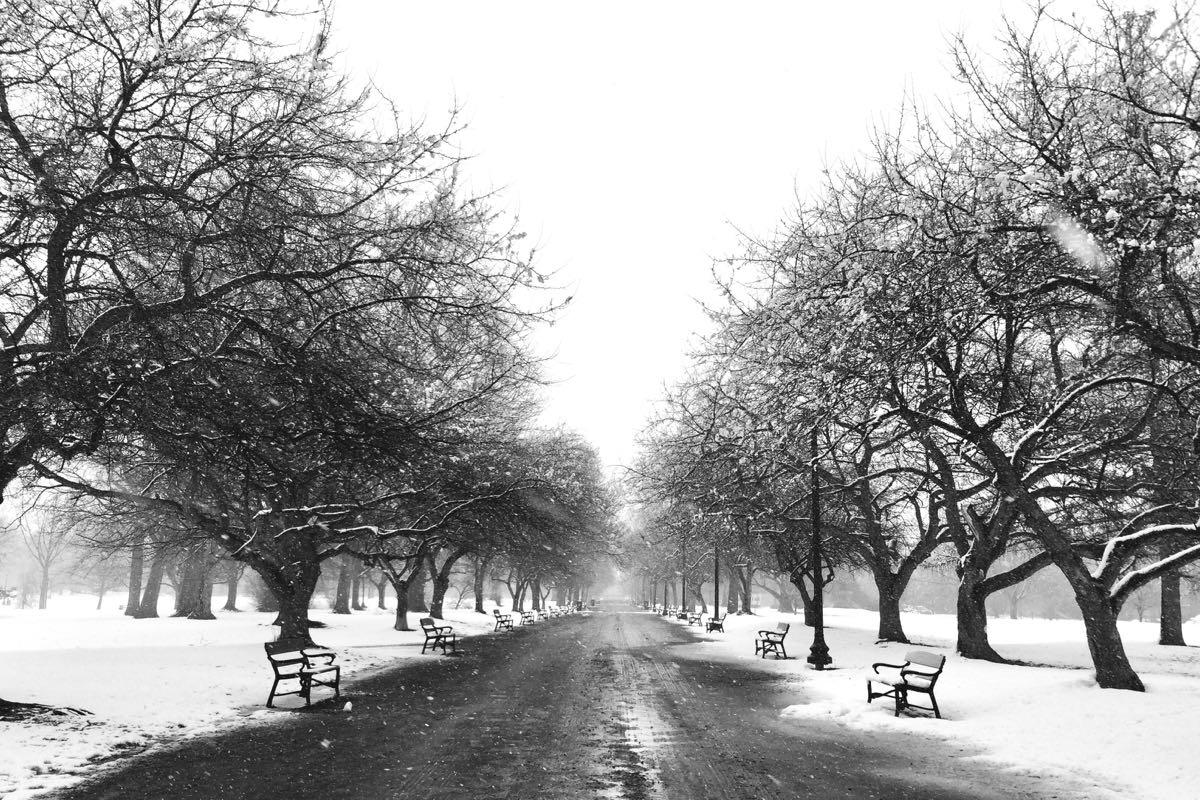
Yep, winter's been odd in recent years
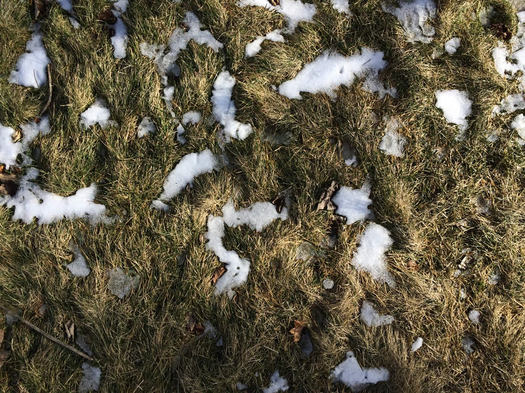
That this sort of sight has been more familiar in recent winters than what we're seeing Thursday is odd.
It's fair to say that winter hasn't been itself for a while, going almost two full seasons now.
Last winter was extraordinarily warm and un-snowy. And this winter has also been... underwhelming. As of February 8, this winter is almost 18 inches behind the normal pace for snow (though it should pick up some of that during Thursday's storm). And the January we just finished had an average temperature 8 degrees warmer than normal.
Winter, we're starting to worry about you, old man.
It's felt like winter has been acting strangely for years now. But memory can be a blurry thing, a picture where the unusual events stay sharp and the ordinary fades into the background.
So we thought it'd be interesting to look at more than a century's worth of winters in Albany to get a sense of whether things really have been weird lately.
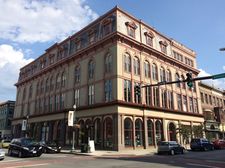
Ice Ages at the State Museum
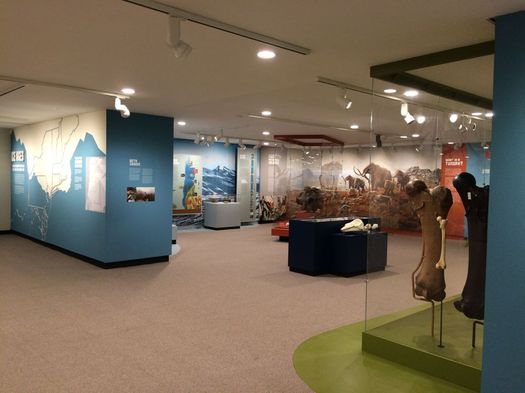
The State Museum opened a new exhibit last week -- Ice Ages -- that is about... well... ice ages in New York. (Surprise!) It's back by the Cohoes Mastodon and worth a stop the next you're at the time museum. It'll be on display until the beginning of 2019.
We got a chance to check out the exhibit recently. And now let us quickly nerd out on a few things from it...
But if there were mountain lions here...
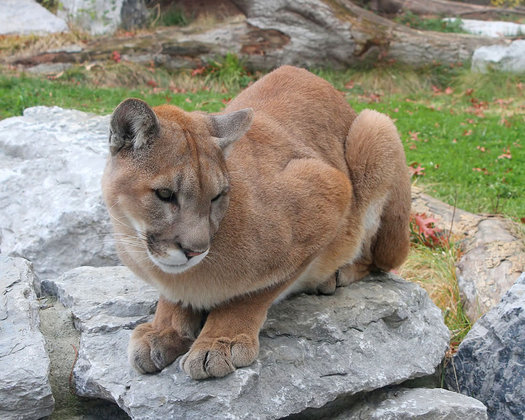
For hire? / photo: Greg Hume (CC BY-SA 3.0) via Wikipedia
An interesting thing about the way the landscape of the Northeast has been changing over the last century is that the amount of forested land has actually increased as many areas that were once cleared for farming have fallen back into being covered by trees.
These new forests aren't exactly like the old forests, though. Among the differences: they lack some of the large predators of the past -- notably cougars/mountain lions and wolves. That might not seem like a big deal for humans -- it might even seem like a good thing, considering those sorts of animals can be a bit fear inducing. But one of the side effects is that deer now lack a natural predator, and their populations have exploded.
There are so many deer. And they cause all sorts of problems -- from car crashes, to disease transmission, to habitat destruction, to grazing on gardens.
So. If we could get some of these predators back in this area -- mountain lions, specifically -- what might that be worth?
Can you answer another round of these 8th grade math questions correctly?
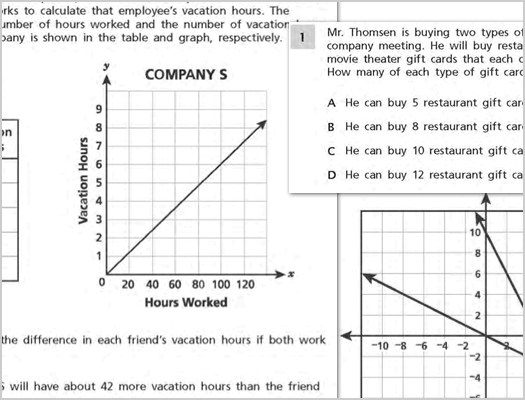
This week the state Education Department released 75 percent of the questions from this year's ELA and mathematics Common Core state tests for grades 3-8. That's about two months earlier than in past years.
In years past we've posted a handful of the 8th grade math questions as a sort of short quiz. And people always seem curious about the question -- and, you know, interested to see if they can answer them.
So we pulled seven questions from this year's 8th grade mathematics test -- they're after the jump with the (hidden) answers.
Science Cafe talks at City Beer Hall
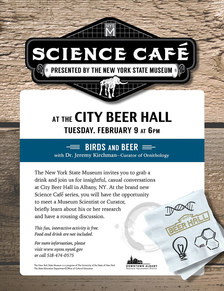 This could be some nerdy fun: The State Museum is starting a series of "Science Cafe" events at the City Beer Hall.
That first Science Cafe event is February 9 and will feature State Museum curator of birds Jeremy Kirchman. Craig Gravina, who's a State Museum exhibit designer (and, of course, also a beer historian), will moderate. We emailed Kirchman for a preview:
I suspect Craig and I will veer off on a few tangents regarding such things as the origin of birds, how I became interested in museum collections and bird evolution, response of birds to climate change, maybe the domestication of chickens if we really end up in the weeds.
The idea with the Science Café is that it will resemble a discussion you might have at a party, more so than a lecture in an auditorium. The series will give the museum scientists a chance to teach the public about on-going research in biology, archaeology, and paleontology, and maybe reach an audience we won't get in our Huxley Theater.
Kirchman says he'll be showing a few pictures, but it won't be a parade of Powerpoint slides.
The Science Cafe event on Tuesday, February 9 is from 6-7 pm. Admission is free, and does not include food or drink.
Earlier on AOA: This part of the State Museum is for the birds
Gather around
EMPAC is often described not just as a collection of performance venues, but also as a research center. And if you've ever wondered what sort of research goes on there (we've been curious) here's one example: a group at EMPAC has created a six-foot-diameter "fire pit" for displaying information to a group of collaborating people.
From the RPI blog The Approach:
The Campfire consists of two main display surfaces, its "wall" and "floor." While they can be largely independent, their shared edge provides a natural interface for various dimensions of visualization, simulation, and interaction. Any traditional two-dimensional images and applications can be placed on the surfaces, but a key innovation is that each of the surfaces has one continuous, potentially shared, dimension. Information can be wrapped around the campfire as in the rings of a tree, the spokes of a wheel, or even in a panoramic view of a real or virtual landscape. The wall can be used to dive into data shown on the floor and vice versa.
The video embedded above provides a short look at how the display in action.
When the sun goes down
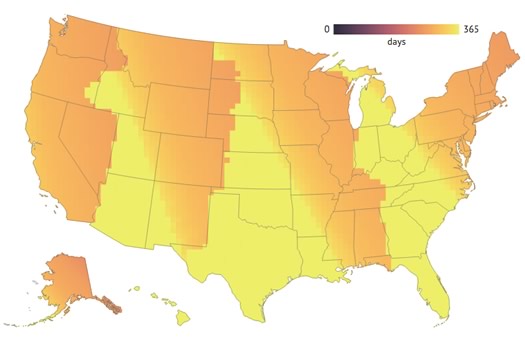
The number of days places have with sunsets after 5 pm under the current standard time/daylight savings time arrangement. / map: Andy Woodruff
Check out this map: It depicts how many days out of the year with sunsets after 5 pm in each place around the United States. It was created by cartographer Andy Woodruff as part of a look at how standard time and daylight savings time affects sunrise and sunset times around the country. Woodruff built interactive maps to depict differences if the country just stayed on standard time all the time -- or went with daylight savings time all the time. (It'll make sense when you see it.) Head on over and click about. [via CityLab]
We're coming up on the shortest daylight day of the year -- it's December 21, the winter solstice (as you know). But if you're anything like us, it's the early sunsets that are kind of gloom inducing. And the earliest sunsets of the year are just about a week away -- December 7-10 -- 4:21 pm.
To illustrate the how the length of sunlight expands and contracts through out the year here, we pulled together a few graphs. Have a look -- they're after the jump.
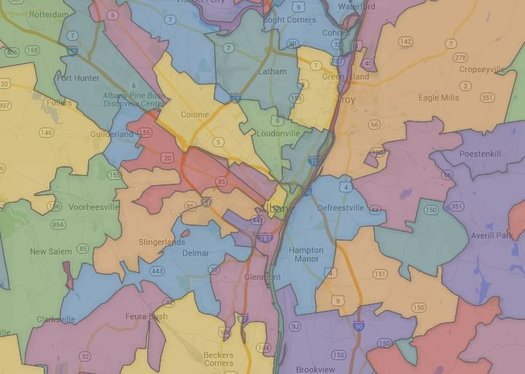
How we make those maps
You can make a map like this. (Really.)
We like maps. And we like to make clickable maps to post here on AOA. Maps about patterns in Census data. Maps about election results. Maps about suggestions you've offered. (We might like all of this a little too much.)
Many of you also seem to like maps. And some of you have been curious about how we make the maps for AOA.
So here's how we do that.
A bunch of numbers about a bunch of different topics
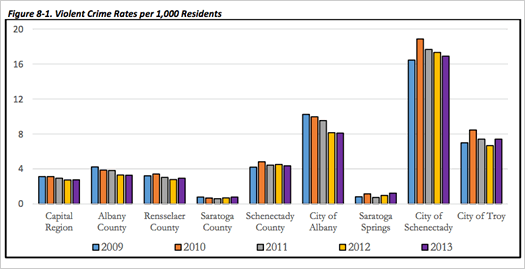
A chart about violent crime from the report.
How many people are here? What's the range of incomes? How are people getting around? What direction are crime rates headed?
Numbers related to those questions -- and many other topics -- are stuffed into the aptly-titled "Capital Region Statistical Report," which was released today by the Capital District Regional Planning Commission.
And it is exactly what it sounds like: a bunch of numbers about a bunch of topics in the Capital Region from a bunch of different sources, all aggregated in one report.
One example is above -- it's a chart from the report about annual violent crimes per 1,000 people in areas of the Capital Region. And it includes this short discussion of the chart:
Can you answer more of these 8th grade math questions correctly?
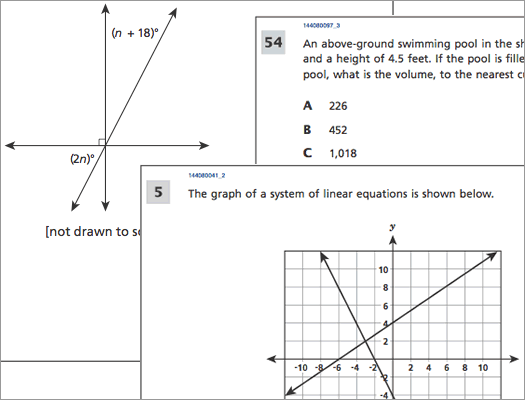
This week the state Education Department released half of the questions from this year's ELA and mathematics Common Core state tests for grades 3-8. NYSED described them as "a representative sample" of questions used on the tests.
Last year we posted a few of the 8th grade math questions as a sort of short quiz. And people to seem to have a good time nerding out on the questions.
So we pulled five more questions from this year's 8th grade mathematics test -- they're after the jump with the (hidden) answers.
The Northeast, man... so full of @!#$%^&*
So pretty much everyone's swearing. We just don't all prefer the same words. The Asshole map. pic.twitter.com/kn65kIHPaa
— Jack Grieve (@JWGrieve) July 16, 2015The map above is one of many like it posted on Twitter by linguist Jack Grieve of Ashton University in England. It's based on almost 1 billion geo-coded tweets over the course of a year and depicts the relative frequency of the word "asshole" in each county. Grieve explains the process over at the Huffington Post.
Here are a bunch of Grieve's maps looking at other curse words.
Interestingly, the northeastern frontier of the "shit" line is in the Hudson Valley.
(Thanks, Tim)
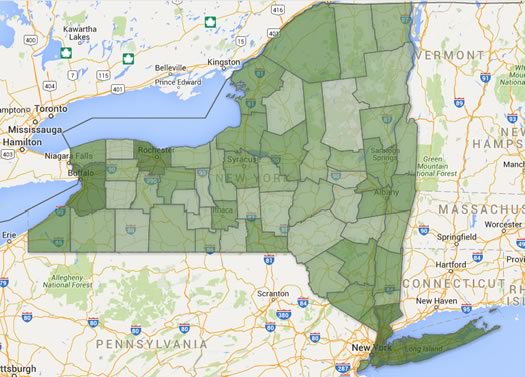
A ZIP code map of New York State
This is just a clip -- the clickable map is after the jump.
As it says on the label, here is a clickable map of ZIP codes (roughly) in New York State.
A while back we had planned to include this map with some discursive post about ZIPs and maps and perceptions of place that was related to the Halfmoon-wants-its-own-ZIP thing, but that post ended up only half baked and unpublished (thankfully -- no one needed to be subjected to that). We were reminded of the map again this week because of the wealthiest ZIP code ranking over at the Biz Review.
Anyway (oh no, here we go...), ZIPs are kind of interesting because of what they started as (a way for the US Postal Service to arrange its routes) and what they've ended up being used for (a way for the rest of us to also identify places). As the ZIP data website ZIP Boundary highlights, a ZIP code doesn't really define an area for the USPS, but rather a collection of delivery points.
And then there are the issues related to the fact that ZIPs are only loosely associated with municipalities -- that's how a place like Crossgates, which is in the town of Guilderland, ends up with a postal address that is Albany (because it's in the 12203 ZIP). Here's an interesting history of ZIPs, again from ZIP Boundary, that touches on that issue.
One of the things that's reinforced for us by looking around the map of Capital Region ZIPs is that the codes aren't necessarily a good way of defining areas (well, unless you're delivering mail). Again, using the 12203 ZIP as an example: it stretches from Washington Park in Albany west along Western Avenue, with lobes that include Guilderland, Bethlehem, and New Scotland -- that's an odd collection to group together.
Right, so... on to the map...
Zero to Maker
![]() The Tech Valley Center of Gravity in Troy is holding a "Zero to Maker" event this Saturday, February 21 from 10 am-1:30 pm. Blurbage: "This event is for anyone interested in becoming a full member of the makerspace, our collaborative workshop for people who enjoy industrial arts, electronics, invention, entrepreneurship, fabrication and design."
The Tech Valley Center of Gravity in Troy is holding a "Zero to Maker" event this Saturday, February 21 from 10 am-1:30 pm. Blurbage: "This event is for anyone interested in becoming a full member of the makerspace, our collaborative workshop for people who enjoy industrial arts, electronics, invention, entrepreneurship, fabrication and design."
The event will be signing up new members and getting them started on different sorts of equipment. Skills on display will include 3D printing, laser cutters, soldering irons and orientation to working in the makerspace.
We hear from TVCOG that a recent informal version of this event turned out to be very popular, so they're asking people to RSVP.
AOA is a media sponsor of TVCOG.
How much snow is that much snow?
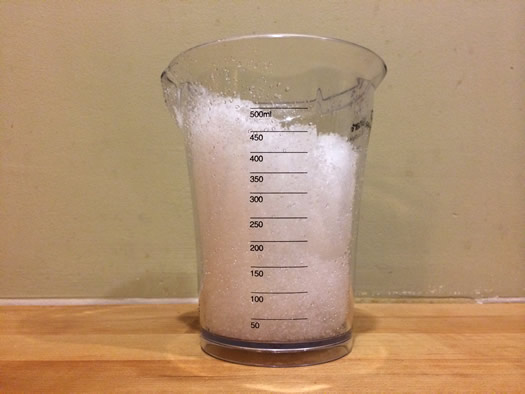
The snow we got from this most recent not-quite-local-snowy-apocalypse was fantastically light and fluffy -- so much so that it almost seemed fake. On Tuesday while clearing the sidewalk we thought it might be the lightest snow we've ever shoveled.
The fluffiness of snow is something that meteorologists pay attention to. Or, to be more specific, they're interested in how much water it takes to create (insert number) inches of snow under given conditions. And if you ever dive into the forecast discussions from the National Weather Service, you'll often see mentions of the snow-to-liquid ratio.
We were curious about getting some more specific sense about how fluffy Tuesday's snow was, so we conducted an (not terribly scientific) experiment.
The first part: Scooping the snow you see above in the photo from an undisturbed part of the yard.
Can you guess how much water was in all that snow when it melted?
Here's the answer...
TOP2014: Crunching the numbers
Corrected to include numbers from the 2013 final.
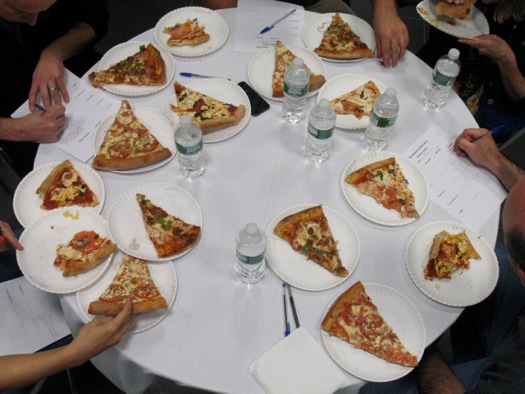
The the 2014 Tournament of Pizza, sponsored by Keeler Mini -- the Tournament of Pizza to end all Tournaments of Pizza -- is almost finished. One last clash of champions remains for this Saturday.
That means it's time for some number crunching. And there are a bunch of numbers now that we have six years of scores in the modern 100-point-scale era of the TOP.

... said KGB about Drawing: What's something that brought you joy this year?